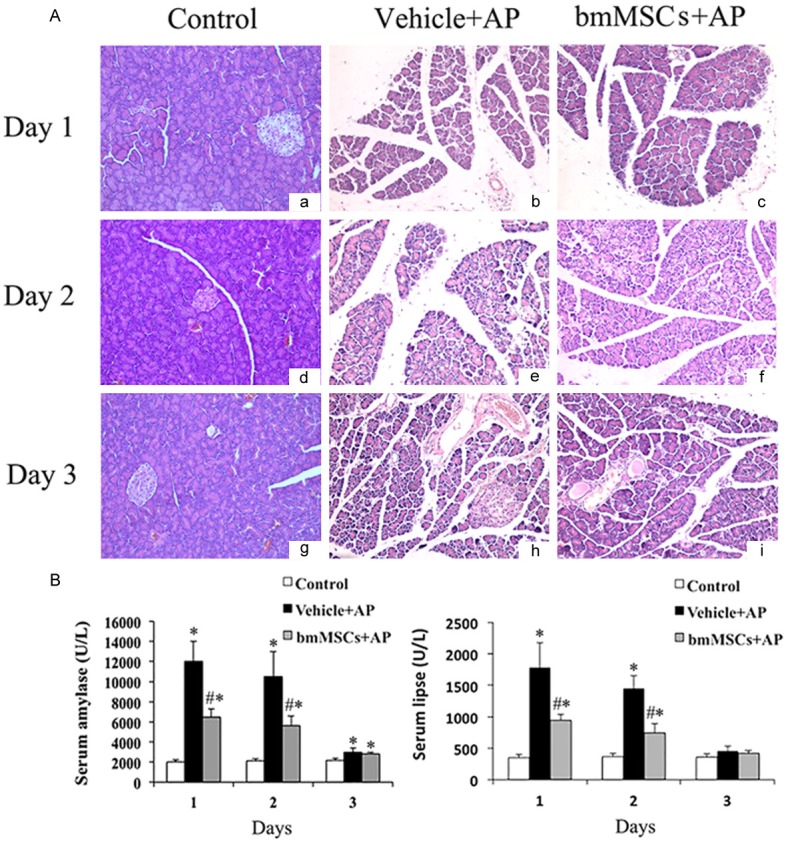
Figure 2.

Histological evaluation of pancreas and serum amylase & lipase levels in L-arg-induced SAP when treated with bmMSCs in vivo. A. Representative H & E-stained sections of the L-arg -induced SAP with the treatment of bmMSCs by histological evaluation(× 200). B. Serum amylase and lipase evaluation in L-arg-induced SAP. *P means P < 0.05 when compared with Control group, #P means P <0.05 when compared with Vehicle + AP group.
