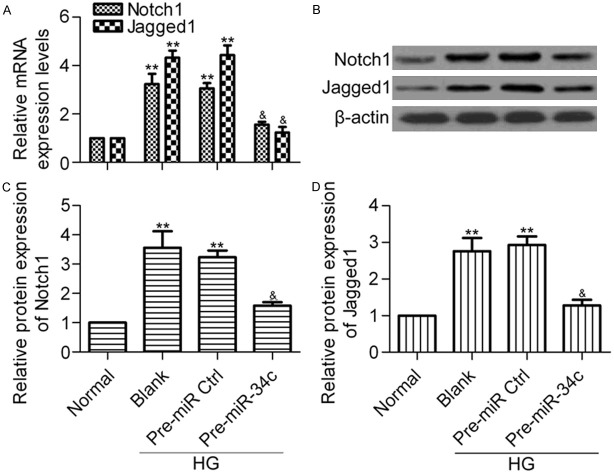
Figure 4.
Effect of miR-34c on the expression of Notch1 and Jagged1. (A) RT-qPCR analysis of the mRNA expression of Notch1 and Jagged1 in different groups. Podocytes treated with pre-miR-34 were stimulated with HG for 48 h before being collected for analysis. N = 3, **P < 0.01 vs. Normal, &P < 0.05 vs. Blank or Pre-miR Ctrl. (B) Western blot analysis of Notch1 and Jagged1 protein expression levels in different groups with indicated antibodies. β-actin was used as the control. Protein levels of Notch1 (C) and Jagged1 (D) were quantified using Image-Pro Plus 6.0 software. Statistical analysis was calculated by one-way ANOVA. N = 3, **P < 0.01 vs. Normal; &P < 0.05 vs. Blank or Pre-miR Ctrl.

