
Figure 6.
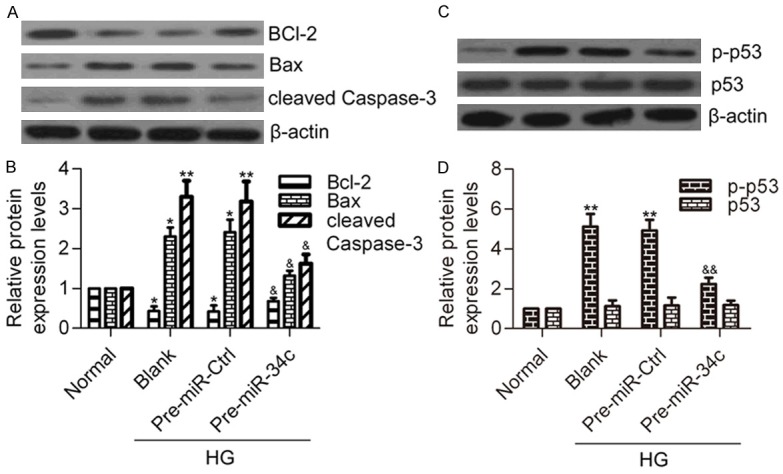
Effect of miR-34c on apoptotic and p53 pathways. A. Western blot analysis of Bcl-2, Bax and cleaved Casapse-3 protein levels in different groups. B. Quantitative protein levels of Bcl-2, Bax and cleaved Casapse-3 were normalized to β-actin using Image-Pro Plus 6.0 software. N=3, *P < 0.05, **P < 0.01 vs. Normal; &P < 0.05 vs. Blank or Pre-miR Ctrl. C. Western blot analysis of p-p53 and total p53 protein levels in different groups. D. Quantitative protein levels of p-p53 and p53. Statistical analysis was calculated by one-way ANOVA. N = 3, **P < 0.01 vs. Normal; &&P < 0.01 vs. Blank or Pre-miR Ctrl.