
Figure 3.
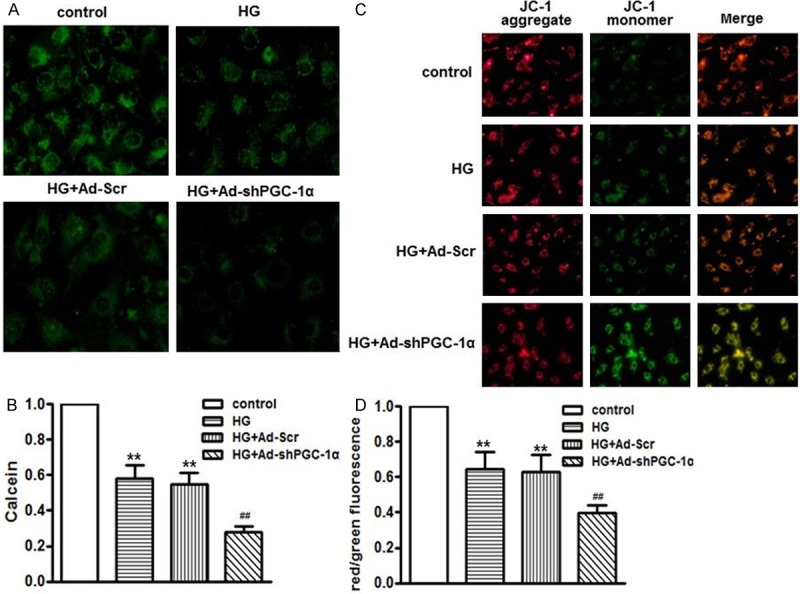
PGC-1α deficiency exacerbated high glucose-induced mitochondrial membrane dysfunction. HUVECs were infected with Ad-Scr or Ad-shp PGC-1α for 24 h, and then were cultured in high glucose medium for another 48 h. A. After treatment, cells were loaded with calcein-AM with Co2+, representative photographs of inner mitochondrial membrane permeabilization was captured by confocal microscopy. B. Quantitative measurements of calcein fluorescence intensity assessed by microplate reader. C. Loss of mitochondrial membrane potential was measured using JC-1 staining by confocal microscopy. Representative images of JC-1 derived fluorescence in HUVECs. D. Quantitative analysis of the ratio of red/green fluorescence. **P < 0.01 vs. control, ##P < 0.01 vs. high glucose alone, n = 6.