
Figure 4.
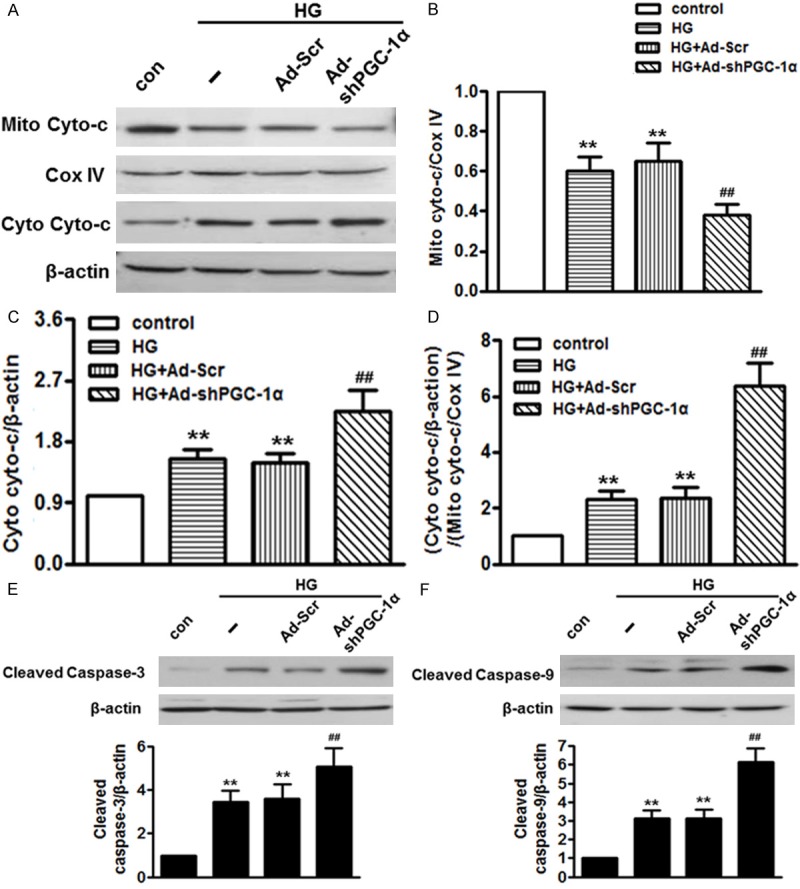
Knockdown of PGC-1α augmented high glucose-induced cytochrome c release and caspases activation. HUVECs were treated with Ad-shPGC-1α for 24 h in prior incubation with high glucose for another 48 h. (A) Western blot analysis of cytochrome c (Cyto-c) protein expression in the mitochondrial and cytosol. (B and C) Densitometric analysis of cytochrome c expression in the mitochondrial (B) and cytosol (C). (D) Densitometric analysis of cytochrome c release from mitochondria to cytoplasm. (E and F) Protein expression of caspase-3 (E) and -9 (F) were measured by western blot. **P < 0.01 vs. control, ##P < 0.01 vs. high glucose, n = 6.