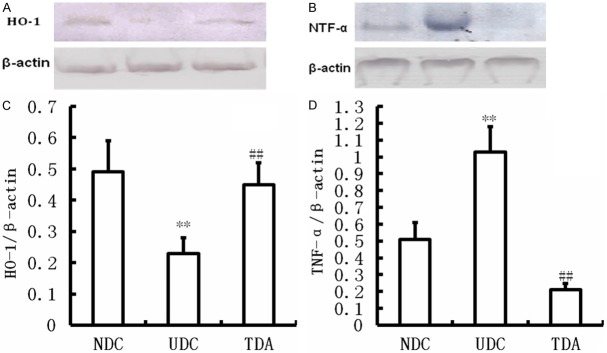
Figure 4.

Effects of H2S on HO-1 and TNF-α protein expression. Western blot showing levels of HO-1 (A) and TNF-α (B) in the wound of Non-diabetic Controls, Untreated diabetic Controls, Treated diabetic administrations. **Significantly different: P<0.01 vs. NDC; ##Significantly different: P<0.01 vs. UDC; n=6 per group.
