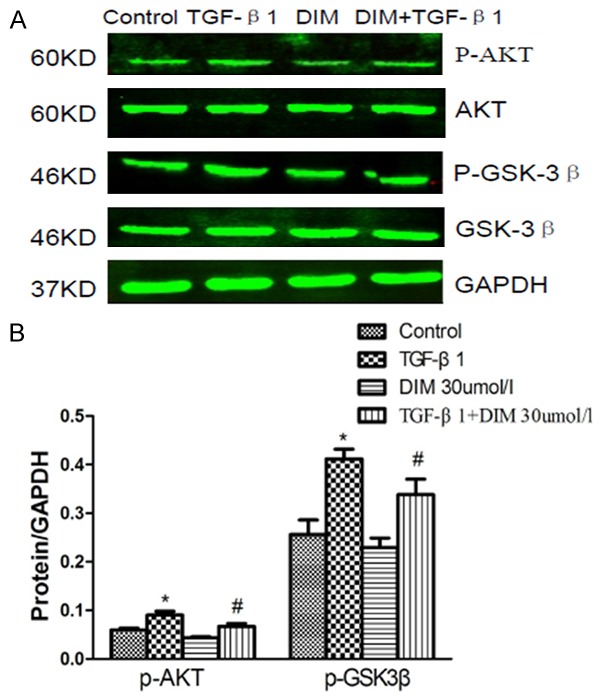
Figure 4.

Effect of DIM on AKT/GSK3β signaling pathways. A: The images of Western blot represent the levels of phosphorylated, total AKT and GSK3β in neonatal rat cardiac fibroblasts. B: The quantitative analysis of Western blot. *P<0.05 compared to control group; #P<0.05 compared with TGF-β1 group.
