
Figure 4.
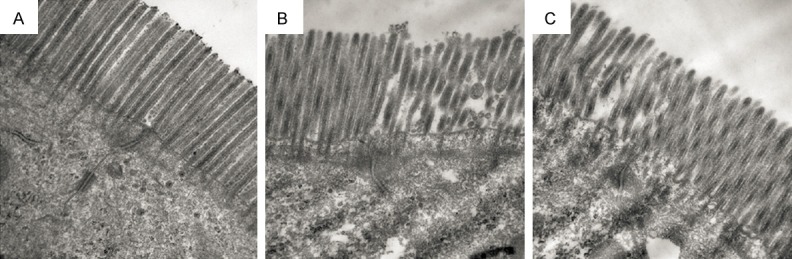
Transmission electron microscopy (TEM) analysis of intestinal tissues of (A) control group, (B) model group and (C) treated group (× 40000).
Official websites use .gov
A
.gov website belongs to an official
government organization in the United States.
Secure .gov websites use HTTPS
A lock (
) or https:// means you've safely
connected to the .gov website. Share sensitive
information only on official, secure websites.
Transmission electron microscopy (TEM) analysis of intestinal tissues of (A) control group, (B) model group and (C) treated group (× 40000).