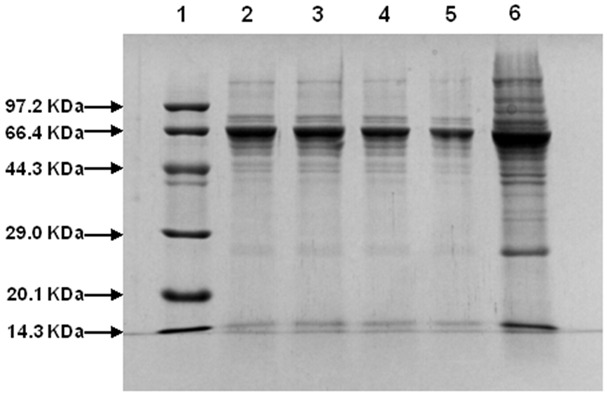
Figure 3.

SDS-PAGE whole protein profiles from bacteria treated and untreated with berberines. Lanes 1 and 6 are marker and untreated cells of S. agalactiae, respectively. Lanes 2-5 are treated cells with berberines at concentrations 1× MIC for 2 h, 4 h, 8 h and 12 h, respectively.
