
Figure 2.
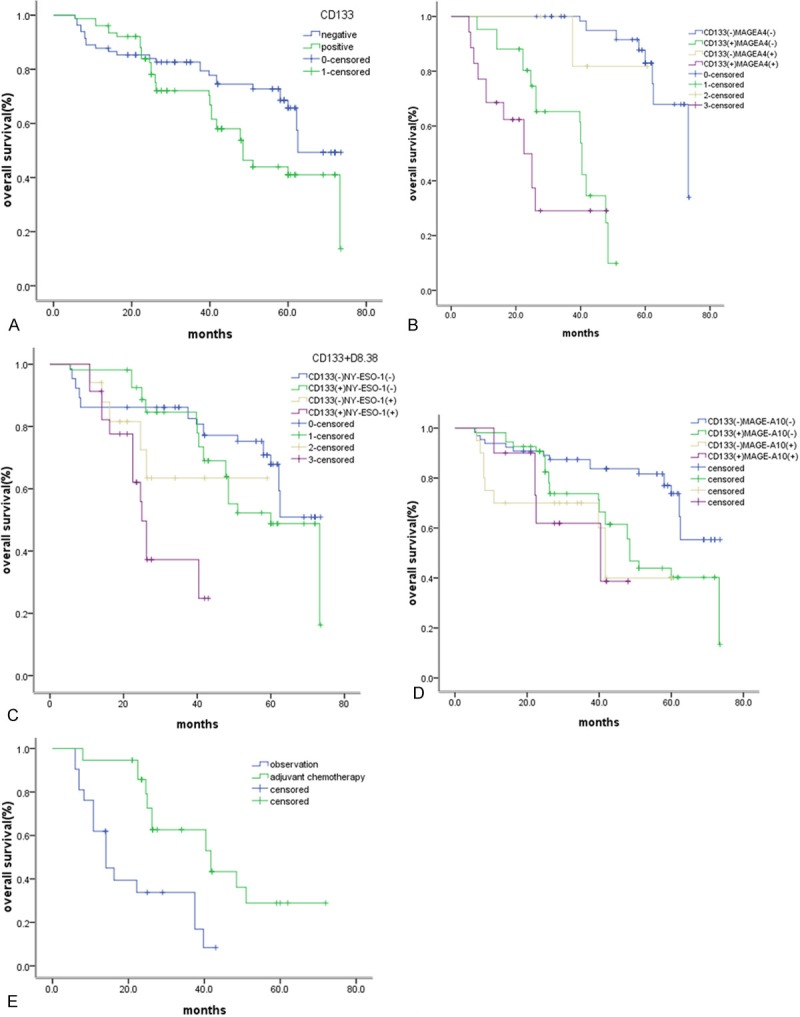
Kaplan-Meier survival curve according to the expression of CTAs and CD133 in patients. A. CD133-/CD133+: 62.5 months vs. 48.5 months, P=0.035) did not receive chemotherapy. B. CD133-MAGEA4-/CD133-MAGEA4+/CD133+MAGEA4-/CD133+MAGEA4+: 65.6 months vs. 51.5 months vs. 32.2 months vs. 19.8 months, P=0.000. C. CD133-NY-ESO-1-/CD133+NY-ESO-1-/CD- 133-NY-ESO-1+/CD133+NY-ESO-1+: 57.8 months vs. 55.7 months vs. 44.6 months vs. 28.5 months, P=0.000. D. CD133-MAGEA10/CD133+ MAGEA10/CD133- MAGEA10/CD133+ MAGEA10+: 66.2 months vs. 57.2 months vs. 48.8 months vs. 41.4months, P=0.001. E. CD133+NY-ESO-1+ patients received chemotherapy or not (received vs. not received, 52.1 vs. 27.1 months, P=0.020.