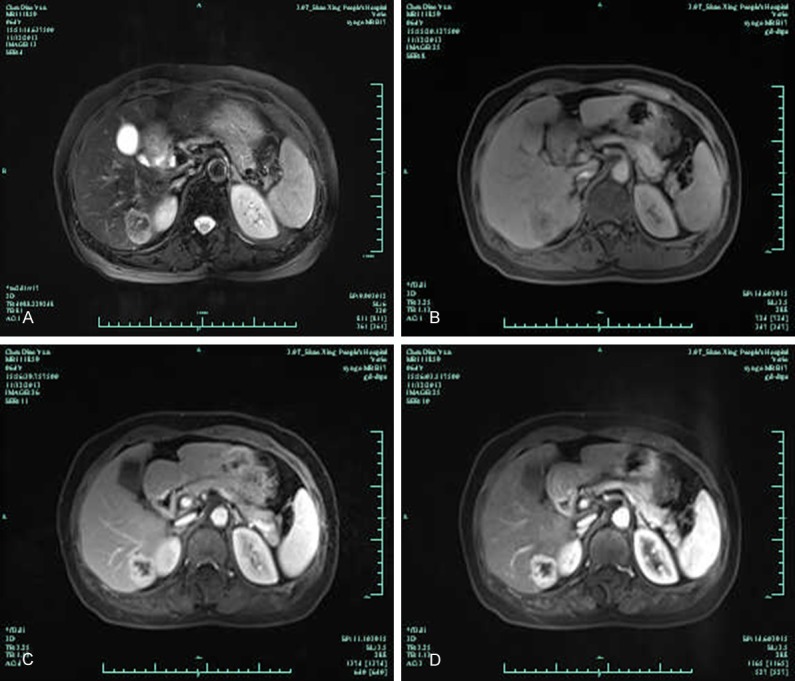
Figure 1.

MRI revealed that the mass showed heterogeneous high signal intensity on T2-weighted images and low signal intensity on T1-weighted images (A and B); dynamic enhanced scanning the mass with an enhancement effect persisting into the portal phase, arterial early phase mass began to strengthen, the arterial late phase enhancement obviously (C and D).
