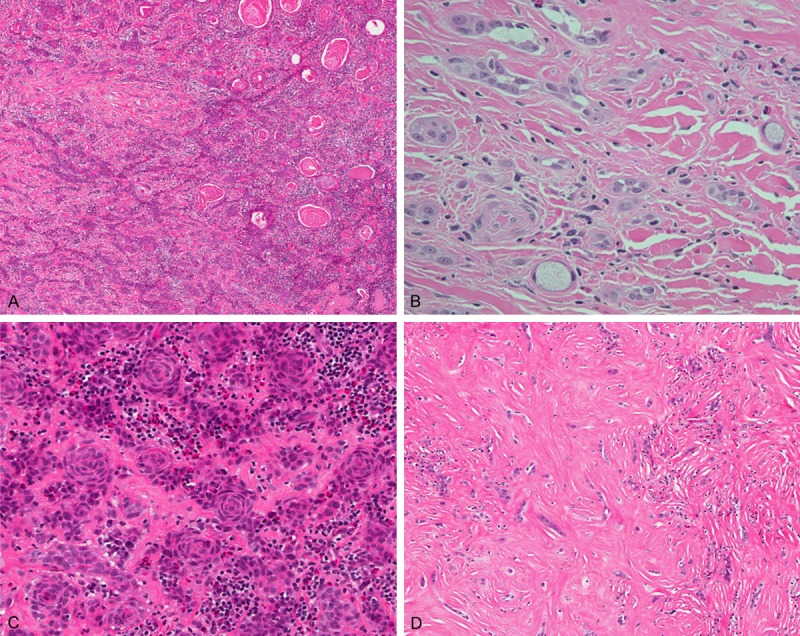
Figure 1.

A. Anastomosing epidermoid tumor cells in a fibrohyaline background with abundant inflammatory cell infiltrates. The squamous differentiation and keratin peals were easily seen. (hematoxylin and eosin 100 ×). B. Rare mucous cells in single cells or small aggregates adjacent to epidermoid component. (hematoxylin and eosin 400 ×). C. Anastomosing epidermoid tumor cells with squamous differentiation. Note the infiltration of eosinophil-rich inflammatory cells in the stroma and tumor nests. (hematoxylin and eosin 200 ×). D. In sclerosing area, the tumor cells were arranged in files, small clusters, or single cells. (hematoxylin and eosin 200 ×).
