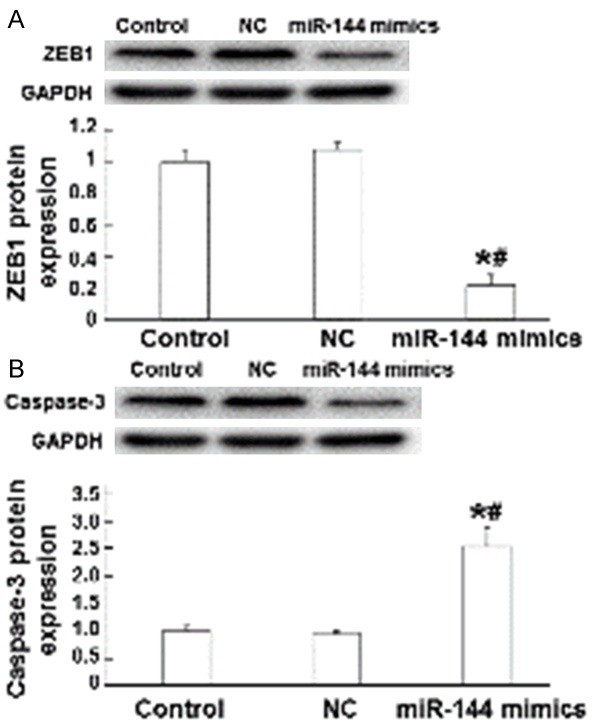
Figure 6.

The effect of miR-144 on the expression of ZEB1 and Caspase-3 proteins. (A) ZEB1 and (B) Caspase-3 protein expression in normal control, negative control, and miR-144 mimics groups. Western blotting was used to measure protein expression. *, P < 0.05 compared with normal control group; #, P < 0.05 compared with negative control group.
