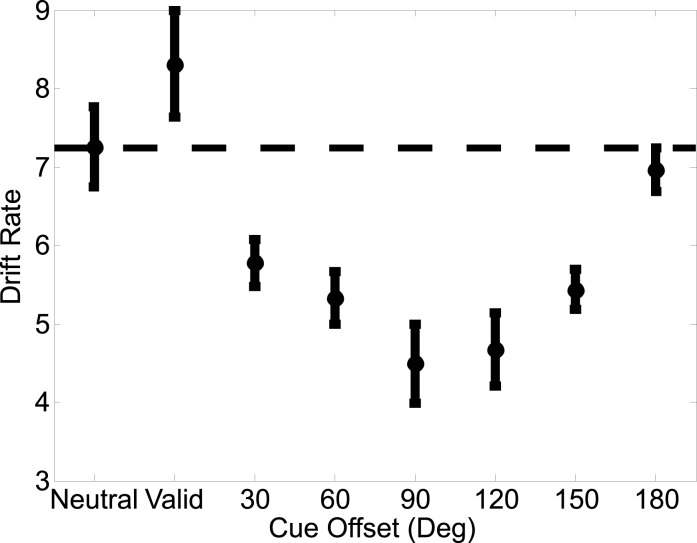
Figure 7.
Drift rates for the accumulators corresponding to the correct response on the different cue conditions for Experiment 2. Mean drift rates corresponding to the correct response on each trial computed across subjects (ordinate) as a function of the eight possible cue conditions (abscissa). Offsets were collapsed across clockwise and counterclockwise directions. All error bars are ±1 SEM, computed after subtracting the mean from each subject.

