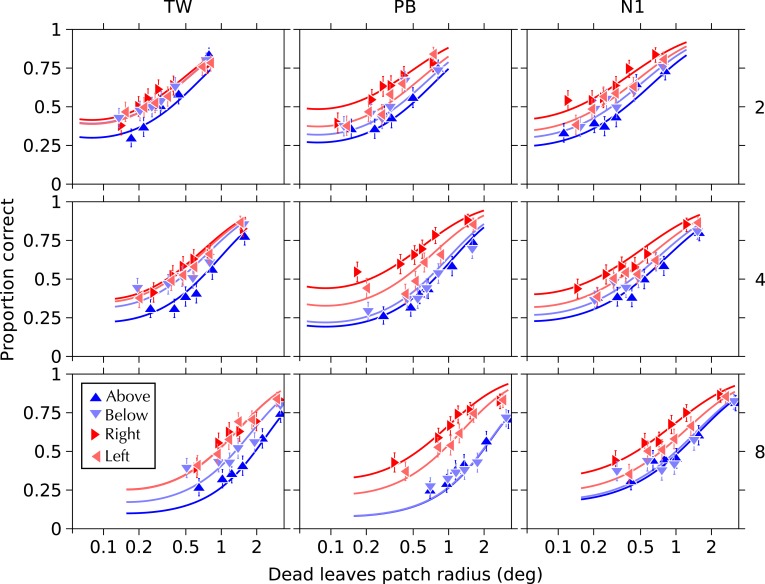
Figure 2.
Performance as a function of patch size and target visual field location relative to fixation, for eccentricities of 2°, 4°, and 8° (rows top to bottom), and target visual field location for three observers (columns left to right). Note logarithmic scale of patch size. Curves show fits of the logistic model favored by model selection. Models were fitted to the raw binary response data. For illustration, these data have been binned into six equally-sized bins (data points). Model fits are plotted from the smallest to the largest patch size presented. Each data point represents approximately 230 trials. Error bars show the 95% beta distribution confidence intervals on the bins.

