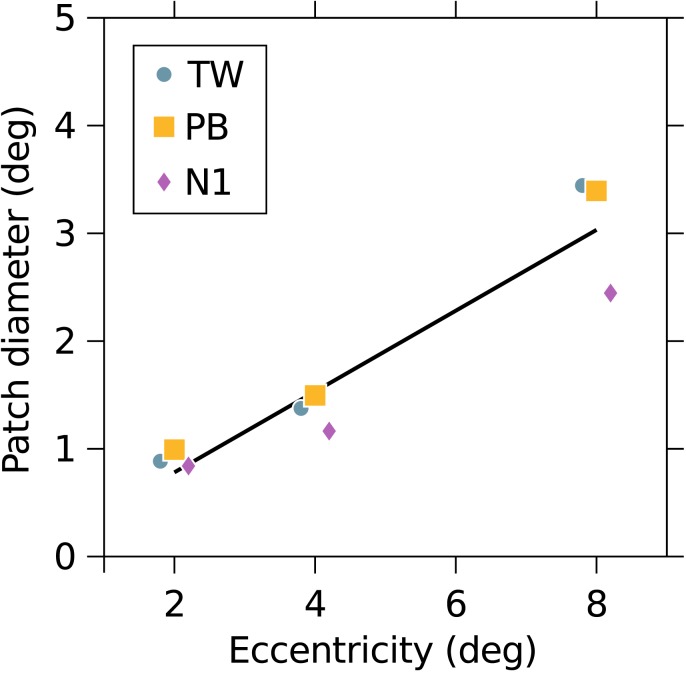
Figure 3.
Threshold patch diameter for each observer as a function of eccentricity. Solid line shows best fit to all points and has a slope of 0.37. Least-squares slopes for individual subjects were 0.44, 0.41, and 0.28 for TW, PB, and N1, respectively. Points have been jittered horizontally to aid visibility.

