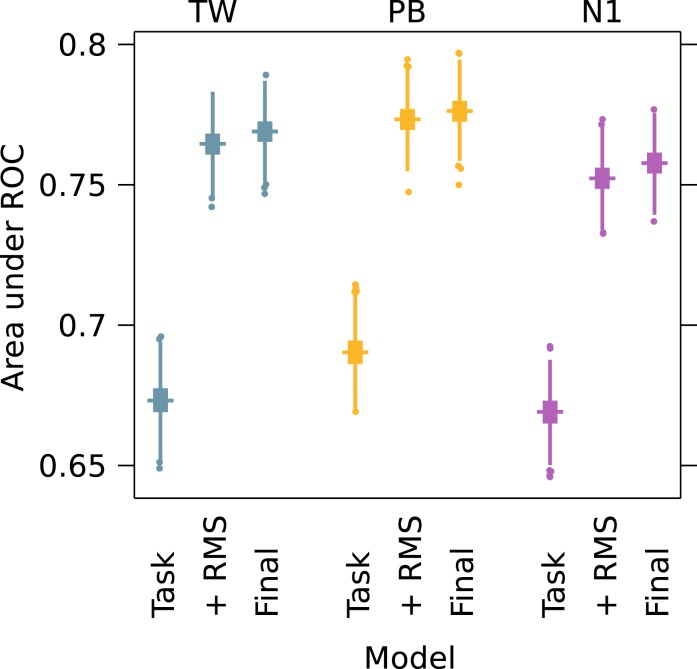
Figure 5.
Model cross-validation. 70% of the data was randomly selected and fit; these coefficients were used to predict responses in the remaining 30% of data. This process was repeated 4999 times for each observer, and distributions of model fit assessed by the area under the Receiver Operating Characteristic (ROC) curve are shown. A value of .5 would indicate that the model discriminates hits from misses no better than chance, whereas a value of 1 would indicate perfect discrimination performance. Bootstrap distributions are represented as box-and-whisker plots where the horizontal line shows the median, the height of the square shows the interquartile range, the whiskers are twice the interquartile range, and samples lying outside this range are presented as points. Here we show the performance of three models: the “Task'' model contains only manipulated parameters (patch size, eccentricity and target location); the “+ RMS'' model is the task model with RMS contrast added, and the “Final'' model is the final model after model selection (containing RMS contrast and edge density). Including image predictors in the model greatly improves predictive performance compared to considering task parameters alone.

