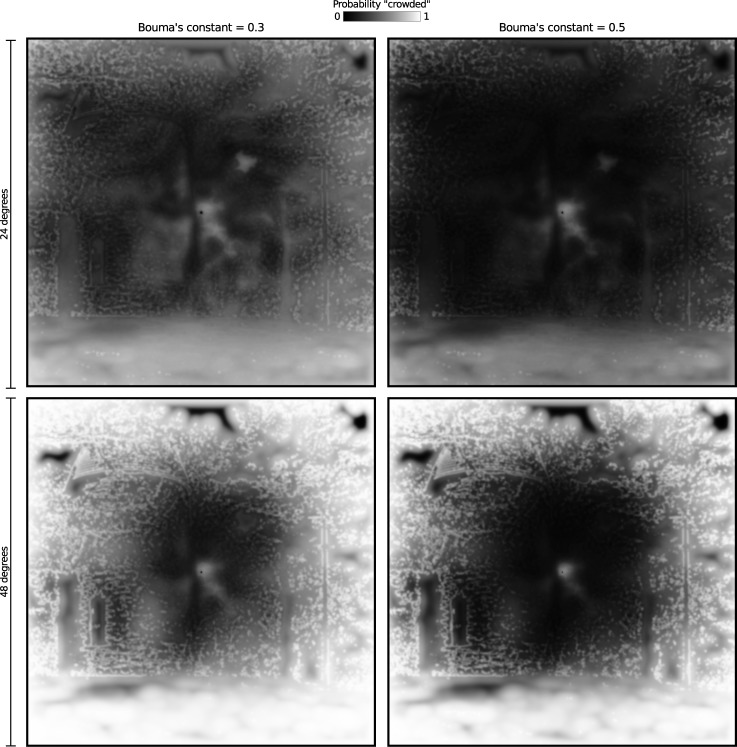
Figure 6.
Model outputs for the image used in Figure 1, assuming an observer fixates centrally. Here we plot the probability of “crowding'' as 1-p, where p is the model's predicted probability of a correct response. Lighter pixels denote areas in which dead leaves discrimination is more difficult; that is, where contrast-matched contours are more likely to be crowded. In the left images, patch diameter (Bouma's constant) was set to 0.3 × eccentricity, whereas in the right images patch diameter was 0.5 × eccentricity. In the top images, the image size is set to 24° (i.e., the borders of the image are imagined to be at 12° eccentricity) whereas in the bottom images the retinal image size is doubled (i.e., viewing distance is halved). These images can be used to gain a sense of how the model weighs the size of the integration region and eccentricity against local image statistics.

