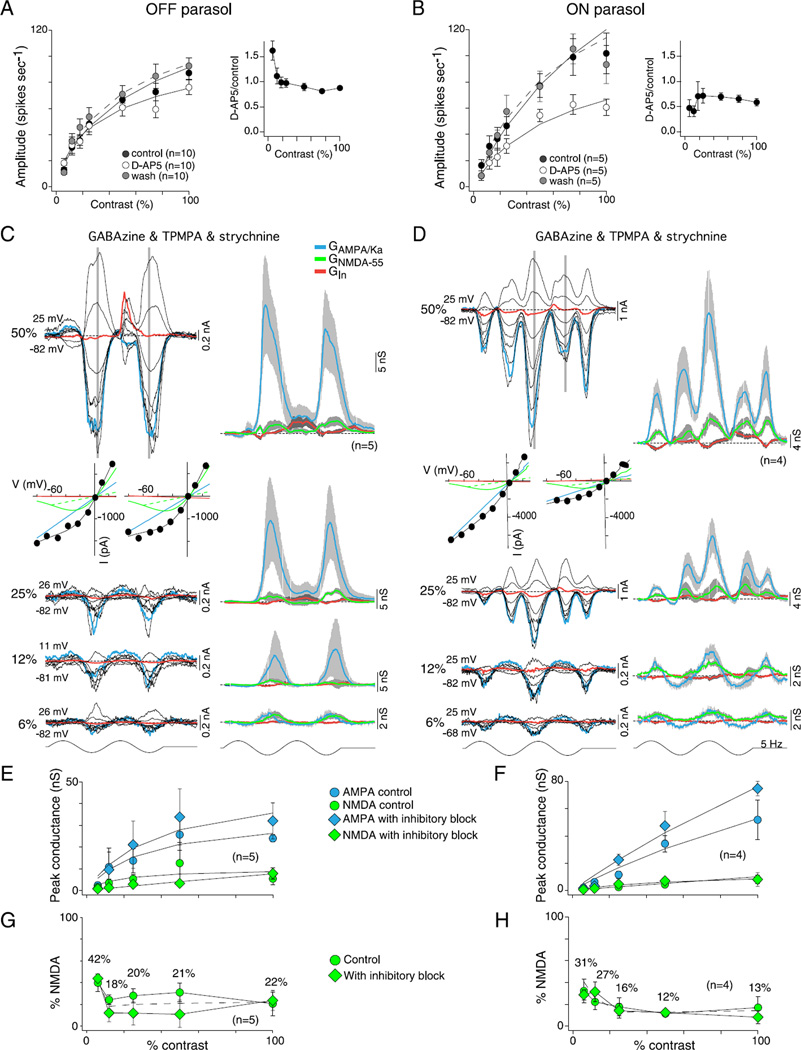
Fig. 11.
Contribution of NMDA receptors to OFF and ON parasol cells contrast sensitivity. (A and B) Effect of D-AP5 (50 µM), a selective NMDA receptor antagonist, on spike discharge in response to variation in stimulus contrast (1-mm field diameter) for OFF (A) and ON (B) parasol cells. Plots show spike response amplitude as a function of contrast for control (solid circles), D-AP5 application (open circles) and wash of D-AP5 (gray circles). Solid lines are Naka–Rushton fits (OFF control se = 0.8, D-AP5 se = 0.5, and wash se = 1.8; ON control se = 2.1, D-AP5 se = 1.9, and wash se = 3.8). Contrast gain values were not significantly altered by D-AP5 in OFF (control 3.6 ± 1.0, D-AP5 4.7 ± 1.1, and wash 3.1 ± 0.4) or ON cells (control 2.8 ± 0.5, D-AP5 2.1 ± 0.4, and wash 3.1 ± 0.4). Inset plots to the right of (A and B) show fractional change in spike rate relative to control values; OFF cells showed a smaller reduction in spike rate than ON cells and also showed a paradoxical increase in spike rate relative to control at the lowest stimulus contrasts. (C and D) Resolution of AMPA/Ka and NMDA conductances at 6, 12, 25, and 50% stimulus contrast during the block of synaptic inhibition (GABAA, GABAC, and glycine receptor block as described in Fig. 5 and 6) for OFF (B) and ON (F) parasol cells. Families of light-evoked post-synaptic currents shown on the left; derived AMPA/Ka, NMDA and inhibitory conductances shown on the right using the model described in Fig. 10 (see also Materials and methods); I–V plots for the 50% responses shown below current traces. (E and F) Plots of peak GAMPA/Ka and GNMDA-55 calculated from control data (circles) and data collected after the block of synaptic inhibition (diamonds) as a function of contrast for OFF (C) and ON (G) parasol cells. Solid lines are Naka–Rushton fits (OFF cells: control AMPA se = 1.4 and NMDA se = 1.4, and inhibitory block AMPA se = 2.0 and NMDA se< 0.3; ON cells: control AMPA se = 1.1 and NMDA se = 0.2 and inhibitory block AMPA se = 2.2 and NMDA se = 0.2). GAMPA/Ka shows steep contrast gain and saturation (OFF cells: contrast gain was 1.6 ± 0.9 for control and 1.3 ± 0.7 with inhibition blocked; ON cells: contrast gain was 0.7 ± 0.1 for control and 1.2 ± 0.2 with inhibition blocked). GNMDA-55 shows a shallow contrast gain without saturation (OFF cells: contrast gain was 0.5 ± 0.2 for control and 0.2 ± 0.0 with inhibition blocked; ON cells: contrast gain was 0.2 ± 0.0 for control and 0.3 ± 0.1 with inhibition blocked). The block of synaptic inhibition increases GAMPA/Ka conductance but has no significant effect on the GNMDA. (G and H) Plot of percentage GNMDA-55 [peak NMDA conductance/(peak total excitatory conductance + peak NMDA conductance)] as a function of contrast for OFF (G) and ON (H) cells calculated from control data (circles) and data collected after the block of inhibition (diamonds). The dotted line indicates the average. As stimulus contrast decreases, the NMDA contribution increases.

