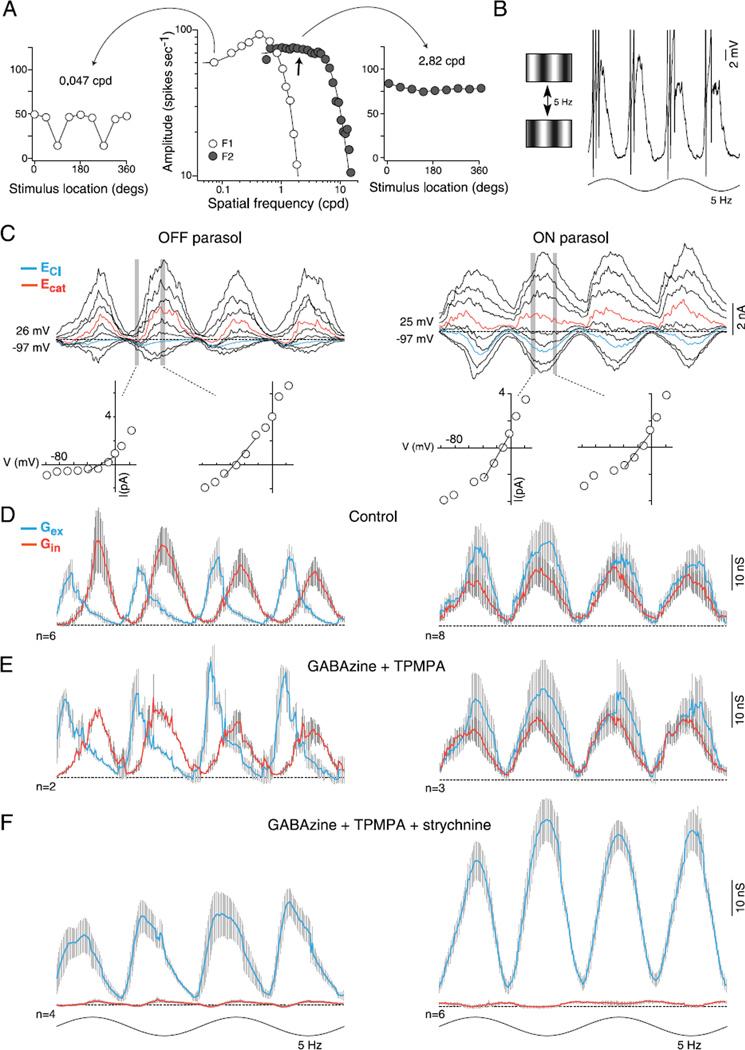
Fig. 4.
Synaptic inhibition is not required for the parasol cell frequency-doubled response to stimuli of high spatial frequency (the “Y-cell signature”). (A) Middle, spatial frequency tuning of an OFF parasol cell; open circles plot spike discharge in response to drifting grating varied in spatial frequency (cpd, cycles/deg of visual angle), and modulated sinusoidally in contrast (5 Hz, 50% contrast; first harmonic amplitude, F1). F1 response is fit with a difference-of-Gaussians center–surround receptive field model (center diameter = 111 µm). Filled circles plot second harmonic (“frequency-doubled,” F2) amplitude to stationary gratings that reverse in contrast (5 Hz, 50% contrast). F2 response is fit with a single Gaussian (center diameter = 31 µm). Either side of the spatial tuning curves are F1 (left) and F2 (right) responses to contrast-reversing gratings of 0.047 cpd (left) and 2.82 cpd (right) as a function of the location of the stimulus relative to the receptive field center (degrees). At 0.047 cpd, F1 dominates and is sensitive to the location of the stimulus (90 and 270 deg), whereas to a finer spatial frequency (2.82 cpd, right), F2 dominates regardless of the location of the stimulus. (B) Left, cartoon of the contrast reversing grating stimulus. Right, intracellular current clamp recording of an OFF cell near the peak of the F2 spatial frequency response (arrow in the middle plot in A). Membrane potential deeply modulates at twice the stimulus frequency. (C) Family of frequency-doubled synaptic currents evoked to contrast reversing gratings at the peak of the spatial frequency response for an OFF (left) and ON parasol cell (right). I—V plots at two time points indicated by vertical gray bars shown below synaptic currents. (D) Average excitatory (Gex, blue) and inhibitory (Gin, red) synaptic conductances for 6 OFF- (left) and 8 ON- (right) center cells. (E) Addition of GABAA (GABAzine, 5 µM) and GABAC (TPMPA, 50 µM) receptor antagonists; average conductance as indicated in (C). OFF cell peak of the excitatory conductance increased from 17 ± 2 to 28 ± 2 nS while peak crossover inhibition showed little change (20 ± 3 to 17 ± 1 nS). ON parasol cells: the peak excitation (22 ± 3 to 25 ± 4 nS) and inhibition (16 ± 2 to 18 ± 1) showed little change. (F) Addition of the glycine receptor antagonist strychnine (1 µM) eliminates the inhibitory synaptic conductance; frequency doubled synaptic excitation is preserved and total excitation is increased in both OFF- (25 ± 2 nS) and ON-center cells (48 ± 3 nS).

