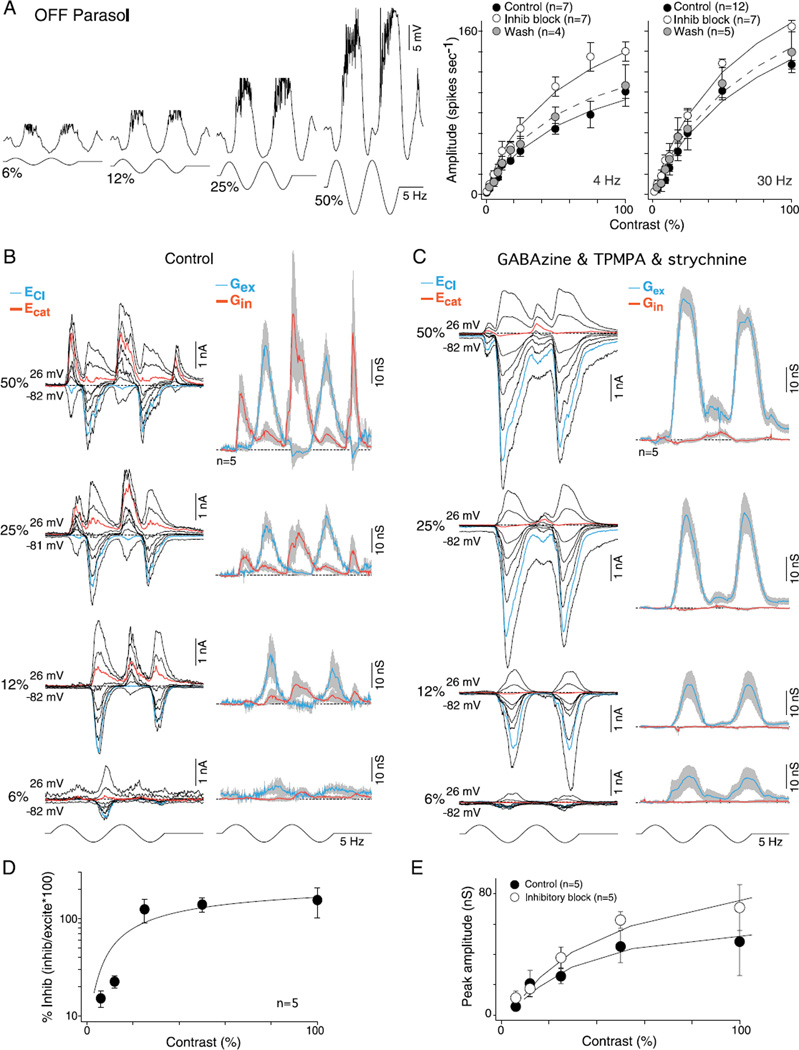
Fig. 5.
Contrast sensitivity of excitatory and inhibitory conductances for OFF-center parasol cells: high sensitivity is mediated by synaptic excitation. (A) Left, intracellular voltage recording of an OFF-parasol to 6, 12, 25, and 50% sinusoidal contrast modulation (5 Hz, 1-mm field diameter). Membrane potential depolarizes during OFF-phase and hyperpolarizes during ON-phase (spikes removed for illustrative purposes). Right, plots of spike rate as a function of stimulus contrast (first harmonic amplitude) for 4- and 30-Hz stimulus temporal frequencies before (solid circles) and after application of GABAA (GABAzine, 5 µM) and GABAC (TPMPA, 50 µM) and glycine (strychnine; 1 µM) receptor antagonists (open circles). Solid lines are Naka-Rushton fits (4Hz: control se = 0.8, inhibitory block se = 1.0, and wash se = 0.8; 30 Hz: control se = 2.3, inhibitory block se = 1.7, and wash se = 2.0; see Materials and methods). Contrast gain values increase for the 4-Hz responses (control 2.7 ± 1.2, inhibitory block 4.7 ± 3.0, and wash 2.8 ± 0.6) and 30-Hz responses (control 3.3 ± 1.3, inhibitory block 4.6 ± 1.9, and wash 3.7 ± 1.9). (B) Left, family of light-evoked synaptic currents (stimulus as in A) for a single OFF-parasol at 6, 12, 25, and 50% contrast. Right, average excitatory (blue) and inhibitory (red) synaptic conductances for five cells (conventions as in Figs. 2 and 3). (C) Data shown as in (B) after the block of GABAergic and glycinergic inhibition, as in (A); excitatory conductances persist at all contrasts and increase in amplitude. (D) Plot of peak mean inhibitory conductance relative to excitatory conductance [peak inhibition/peak (excitation + inhibition)]. Percent of synaptic inhibition was calculated on a cell-by-cell basis. Inhibition is greatly reduced relative to excitation at lower contrasts. Solid line is a Naka-Rushton fit (se = 11.4). (E) Peak excitatory conductances before (solid circles) and after (open circles) the addition of GABA and glycine receptor antagonists plotted as a function of contrast. Solid lines are Naka-Rushton fits (control se = 1.8 and inhibitory block se = 2.0). Contrast gain increases from 1.4 ± 0.3 to 2.5 ± 0.6.

