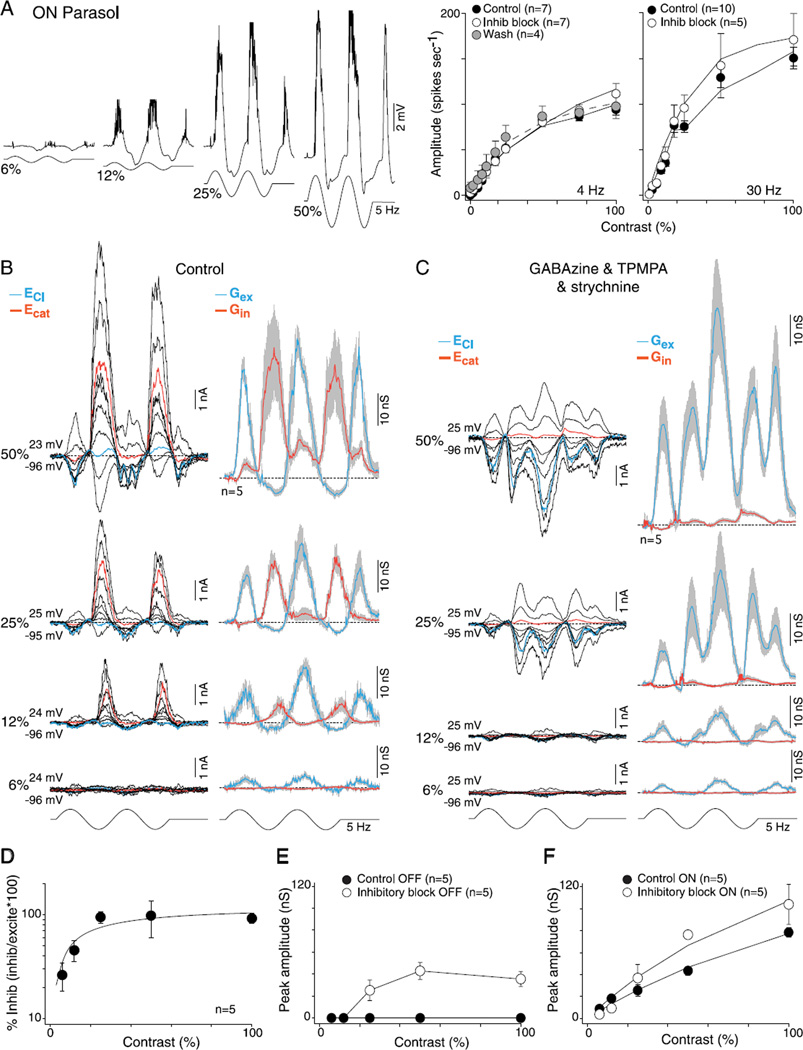
Fig. 6.
Contrast sensitivity of excitatory and inhibitory conductances for ON-center parasol cells: high sensitivity is mediated by synaptic excitation. (A) Left, intracellular voltage recording of an ON-parasol to 6, 12, 25, and 50% sinusoidal contrast modulation (5 Hz, 1-mm field diameter). Membrane potential depolarizes during ON-phase and hyperpolarizes during OFF-phase (spikes removed for illustrative purposes). Right, plots of spike rate as a function of stimulus contrast (first harmonic amplitude) for 4- and 30-Hz stimulus temporal frequencies before (solid circles) and after (open circles) application of GABAA (GABAzine, 5 µM) and GABAC (TPMPA, 50 µM) and glycine (strychnine, 1 µM) receptor antagonists. Solid lines are Naka–Rushton fits (4Hz: control se = 1.4, inhibitory block se = 0.9, and wash se = 1.4; 30 Hz: control se = 3.1 and inhibitory block se = 4.7). Contrast gain values increase for the 4-Hz (control 2.7 ± 0.7, inhibitory block 2.9 ± 1.3, and wash 4.3 ± 1.8) and 30-Hz responses (control 4.0 ± 1.1 and inhibitory block 5.8 ± 2.3). (B) Left, family of light-evoked synaptic currents (stimulus as in A) for a single ON-parasol at 6, 12, 25, and 50% contrast. Right, average excitatory (blue) and inhibitory (red) synaptic conductances for five cells (other conventions as in Figs. 2 – 5). (C) Data shown as in (B) after the block of GABAergic and glycinergic inhibition, as in (A). Excitatory conductances persist at all contrasts and increase in amplitude. (D) Plot of the peak mean inhibitory conductance relative to excitatory conductance [peak inhibition/peak (excitation + inhibition)]. Percent of synaptic inhibition was calculated on a cell-by-cell basis. Inhibition is greatly reduced relative to excitation at lower contrasts. Solid line is a Naka–Rushton fit (se = 5.9). (E) Peak unmasked excitation before (solid circles) and after (open circles) the addition of GABA and glycine receptor antagonists plotted as a function of contrast. Solid lines connect the data points. (F) Peak ON excitatory conductances before (solid circles) and after (open circles) the addition of GABA and glycine receptor antagonists plotted as a function of contrast. Solid lines are Naka–Rushton fits (control se = 1.4 and inhibitory block se =3.3). Contrast gain increases from 1.4 ± 0.2 to 2.0 ± 0.4.

