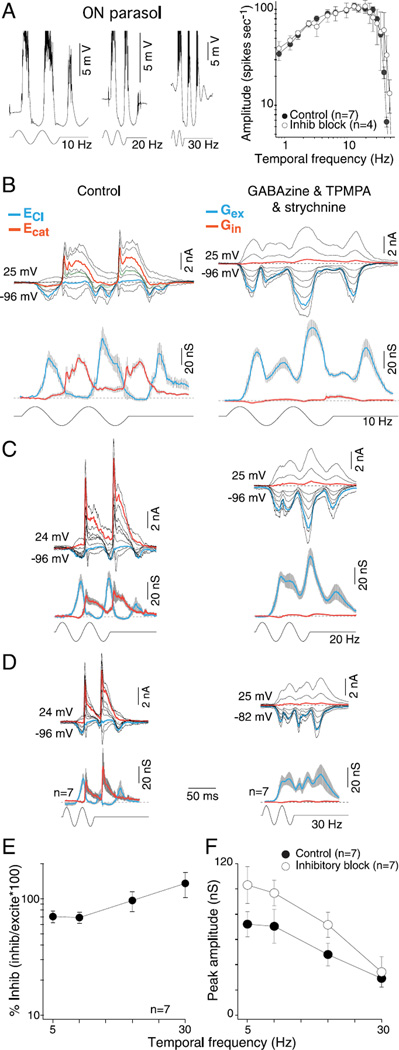
Fig. 8.
Temporal tuning of excitatory and inhibitory conductances for ON-center parasol cells: high sensitivity is mediated by synaptic excitation. (A) Left, intracellular voltage recording of an ON-parasol to 10-, 20-, and 30-Hz temporal frequency modulation (50% contrast, 1-mm stimulus diameter). Membrane potential depolarizes during ON-phase and hyperpolarizes during OFF-phase after a latency to stimulus onset of ~35 ms (spikes removed for illustrative purposes). Right, plots of spike rate as a function of stimulus temporal frequency (50% contrast; 1-mm stimulus diameter; first harmonic amplitude) before (solid circles) and after (open circles) application of GABAA(GABAzine, 5 µM) and GABAC (TPMPA, 50 µM) and glycine (strychnine; 1 µM) receptor antagonists. (B–D) Family of stimulus-evoked synaptic currents to 10 Hz (B), 20 Hz (C), and 30 Hz (D) temporal modulation before (upper left) and after (upper right) the addition of GABAzine, TPMPA, and strychnine. Lower left and right, mean excitatory (blue) and inhibitory (red) synaptic conductances derived from sample number indicated for each associated stimulus condition. (E) Plot of percentage peak inhibitory conductance relative to excitatory conductance [peak inhibition/peak (excitation + inhibition)] as a function of temporal frequency. Percent of synaptic inhibition was calculated on a cell-by-cell basis. Crossover inhibitory conductance is maintained and increases relative to excitatory conductance with increasing temporal frequency. (F) Average peak ON conductances before (solid circles) and after (open circles) the block of synaptic inhibition plotted as a function of temporal frequency.

