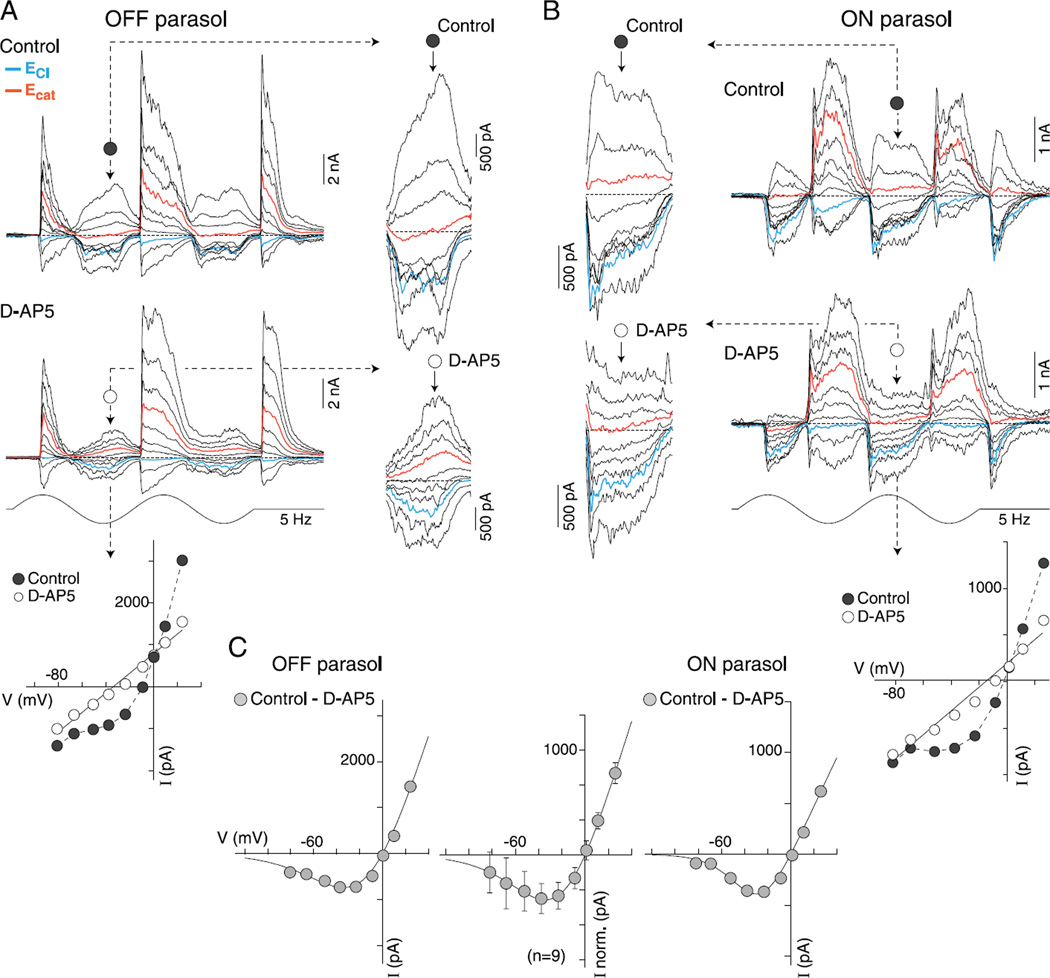
Fig. 9.
Application of D-AP5 linearizes the current-voltage relationship of excitatory synaptic currents and reveals similar NMDA receptor-mediated synaptic currents in both OFF and ON parasol cells. (A and B) Family of light-evoked synaptic currents (5 Hz, 2 stimulus cycles, 50% contrast, 1-mm stimulus diameter, effective quanta ~1.1 × 10⁵photons/s/µm2) from an OFF- (A) and an ON-center (B) parasol before (control, upper trace family) and after (lower trace family) application of NMDA receptor antagonist, D-AP5 (50 µM). Insets (indicated by dotted arrows) show enlargement of excitatory response phase (decrement for OFF cells, increment for ON cells) for all traces currents near ECl and Ecat indicated in blue and red, respectively. Nonlinearity at negative holding potentials is evident in traces and is greatly reduced after D-AP5 application. Plots below traces show I–V relationship in control (filled circles) and after D-AP5 (open circles) at a time point indicated by a dotted arrow. (C) Plot of subtraction of D-AP5 from control I–V gives an estimate of NMDA-mediated I–V relationship for the OFF (left plot) and ON (right plot) cell examples. Plot at center shows average I–V for 9 parasol cells (6 OFF and 3 ON cells; error bars ± s.d.). Data for the individual and averaged I–V s are least squares fit with a function that describes the voltage dependence of the NMDA receptor conductance (KMg = 3.5 mM and Vδ = 22 mV; see Materials and methods for details).

