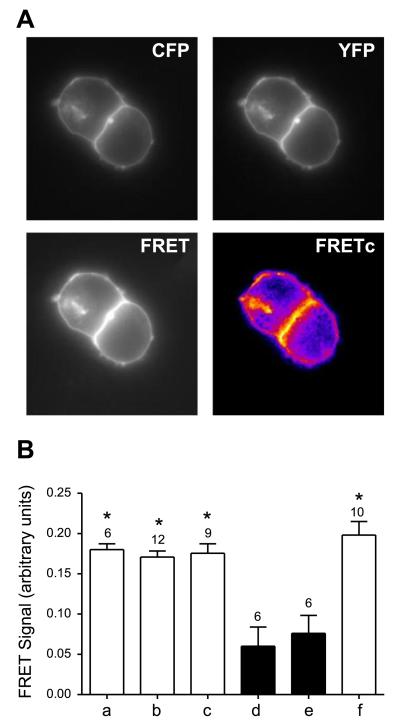
Figure 2.
Interaction between hOCT2 and hOCT2 visualized by FRET microscopy. A) High magnification of HEK293 cells transfected with hOCT2-YFP and hOCT2-CFP (top left panel, CFP channel; top right panel, YFP channel; bottom left panel, FRET channel; bottom right panel, corrected FRET channel). FRETc images are displayed using pseudocolors. B) Results of FRET analysis in living HEK293 cells expressing hOCT2-CFP and hOCT2-YFP protein pairs tagged at the C or N terminus (bar a, hOCT2-CFP-C and hOCT2-YFP-C; bar b, hOCT2-CFP-C and hOCT2-YFP-N; bar c, hOCT2-CFP-N and hOCT2-YFP-N). Positive-control experiments included cells transfected with a CFP-YFP tandem construct (not shown) and cells coexpressing SERT-CFP and SERT-YFP (bar f); negative controls included cells cotransfected with CFP and YFP (not shown) and cells coexpressing PALM-MYR-YFP and hOCT2-CFP (bar d, hOCT2-CFP-C; bar e, hOCT2-CFP-N). Intensity of FRET was measured for the different combinations of CFP/YFP pairs and expressed as normalized FRET values, as described in Materials and Methods. Values are means ± se; numbers above bars denote number of monolayers. *P < 0.05 vs. negative controls; ANOVA.

