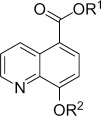
Table 1.
Structure–activity relationships for IOX1 (1) and its ester derivatives 2–7
 | |||||
|---|---|---|---|---|---|
| Compd | R1 | R2 | CC50[a] [μm] | EC50[b] [μm] | IC50[c] [μm] |
| 1 | H | H | >300 | 100.0 | 0.6 |
| 2 | CH3 | H | 10 | 50.0 | 10.7 |
| 3 | CH2CH3 | H | 66 | >100 | 14.9 |
| 4 | (CH2)3CH3 | H | 50 | 22.0 | 5.0 |
| 5 | (CH2)7CH3 | H | >300 | 3.8 | 3.9 |
| 6 | CH3 | COCH3 | 29 | >100 | 10.5 |
| 7 | CH2OCOC(CH3)3 | CH2OCOC(CH3)3 | 17 | – | >100 |
[a] CC50 values derived from HeLa cell viability assays. [b] EC50 values derived from immunofluorescence assays of KDM4A activity in HeLa cells. [c] IC50 values derived from AlphaScreen assays of isolated KDM4C. Data represent the mean of n≥3 replicates (Figures S1, 2, and 5 in the Supporting Information).
