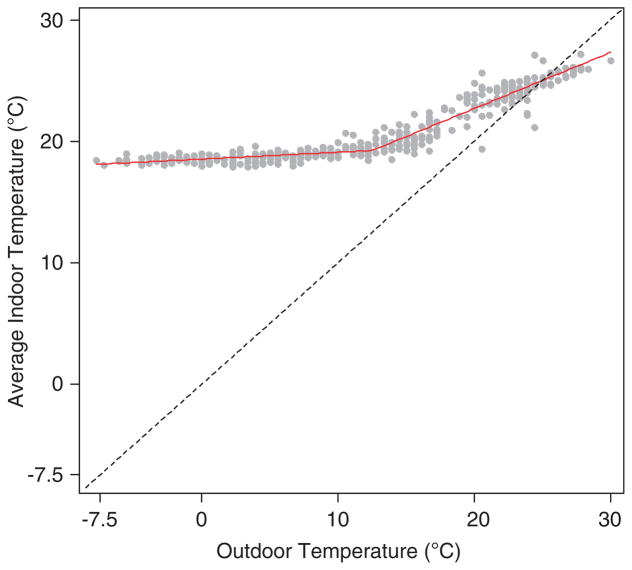
Figure 2.
Scatterplot and piecewise regression line relating daily outdoor temperature measured at Boston Logan International Airport to average daily indoor temperature in 16 homes from January to December 2011, Greater Boston, MA, USA. Knot location is at 12.5 °C. For temperatures <12.5 °C, Pearson’s correlation coefficient, r = 0.61; β = 0.06, standard error (SE) = 0.008. For temperatures ≥12.5 °C, r = 0.91; β = 0.41, SE = 0.016. Dashed line, y = x (45°) line.

