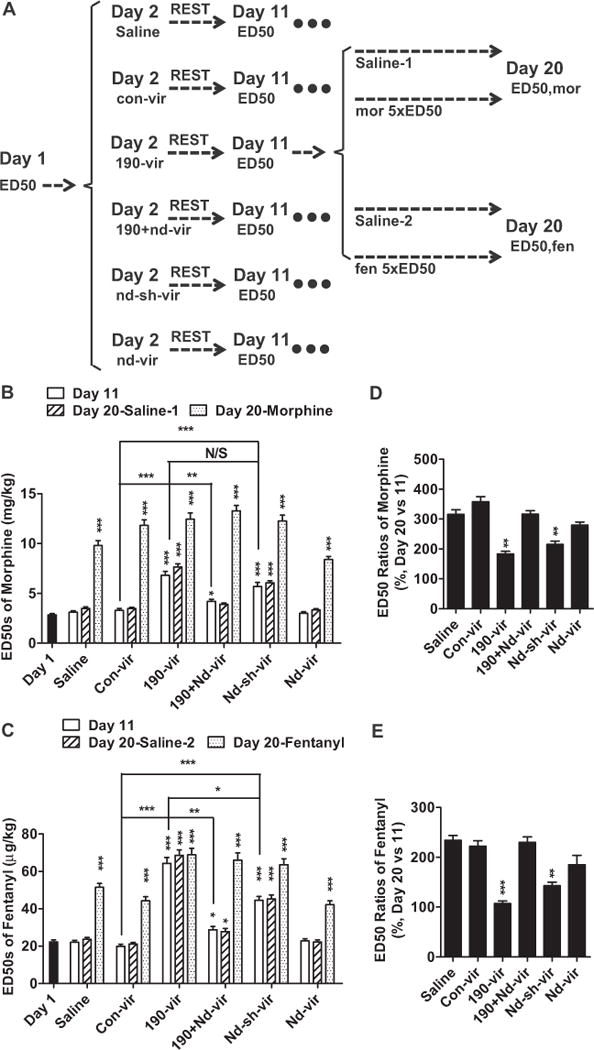
Figure 1.

Decrease in NeuroD1 activity affected opioid antinociception and tolerance development. (A) Mice were injected with saline or different lentivirus on day 2 and received daily injection of saline or opioid (morphine or fentanyl) from day 12 to day 19. Six mice groups were divided into four subgroups, with more than eight mice in each subgroup. (B, C) The ED50 values of opioids were determined on day 1, day 11, and day 20 and summarized for morphine (B) and fentanyl (C). (D, E) Tolerance or ED50 ratios were calculated by normalizing ED50 values on day 20 to ED50 values on day 11. The results were also summarized for morphine (D) and fentanyl (E). One-way analysis of variance with Dunnett test as post hoc was used for comparisons between the basal level—day 1 (B, C) and saline (D, E)—and all other data in the same data set. Only significant differences were listed. *p < .05, **p < .01, ***p < .001. Additional comparisons were performed between indicated lanes. 190-vir, miR-190; con-vir, control vector; ED50, median effective dose; fen, fentanyl; mor, morphine; nd-sh-vir, short hairpin RNA against Neurod; nd-vir, Neurod1; N/S, not significant.
