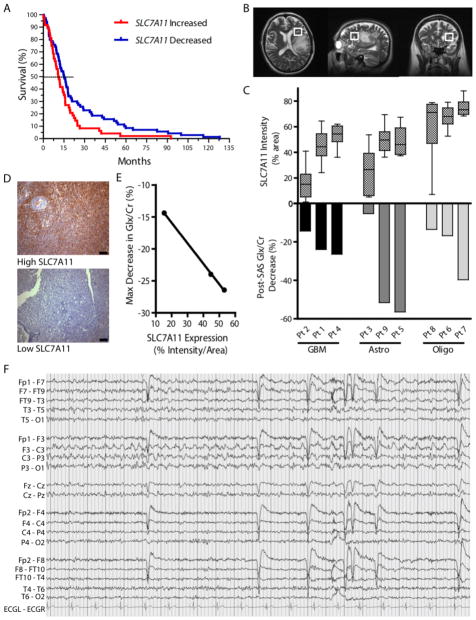
Fig. 6.
Glioma SXC expression predicts patient survival and peritumoral glutamate response. (A) Kaplan Meier survival plot of patients in the Repository for Molecular Brain Neoplasia Data (REMBRANDT) database comparing gliomas with high SLC7A11 (≥150%) versus low expression (≤ 66%) of the SXC gene SLC7A11, compared to non-neoplastic brain (n=120 glioma (all grades) patients; Kaplan Meier analyzed using the log-rank test, P=0.0238). (B–E) Detection of peritumoral glutamate (Glx) measured by Magnetic Resonance Spectroscopy (MRS) in glioma patients before and after an acute sulfasalazine (SAS) dose (1 g). (B) Representative images showing voxel placement. (C) Peritumoral glutamate, detected as a peak composed of glutamate + glutamine (Glx), which is predominately glutamate(27), and quantified with respect to creatine (Cr). Intracranial Glx/Cr changes after SAS administration (Post-SAS) are graphed (bottom) and compared to SLC7A11 expression in patient glioma tissue (top) quantified by staining intensity (n=3 tissue samples per patient, total n=27; glioma types include glioblastoma (GBM), Astrocytoma (Astro), and Oligodendroglioma/Oligoastrocytoma (Oligo); Means ± SEM; ANOVA, P<0.0001). (D) Examples of high and low SLC7A11 staining of patient glioma tissue. Scale bars, 100 μM. (E) Linear correlation between maximum Glx/Cr decrease and GBM tissue SLC7A11 expression (Linear regression; *P=0.0134; R2=0.9996). (F) Tracing of ictal discharge from Pt. 8, showing left centroparietal focal seizure best appreciated in leads F3/C3 and C3/P3. High-frequency filter (HFF) = 30 Hz; timebase = 15 mm/sec.

