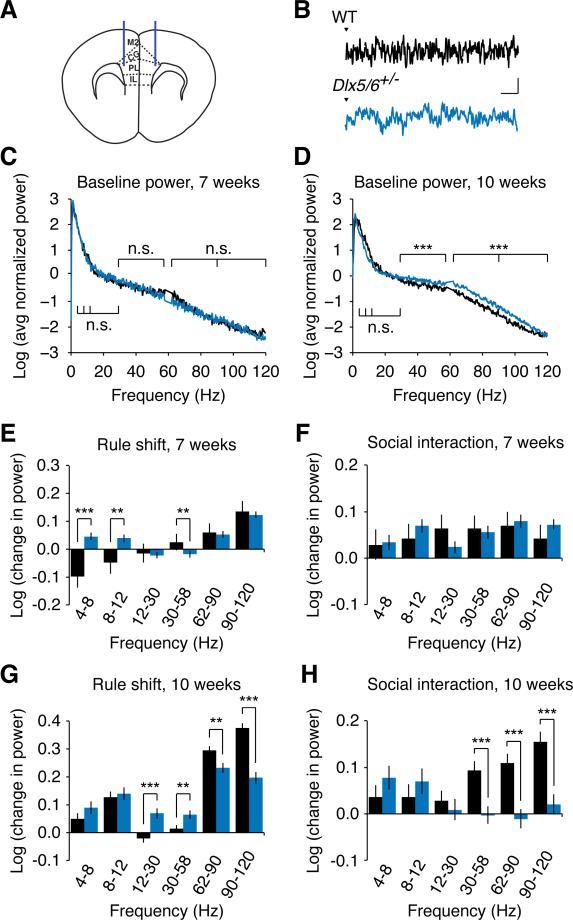
Figure 4. Adult (but not adolescent) Dlx5/6+/− mice exhibit abnormal baseline γ oscillations and deficient task-evoked prefrontal γ oscillations.
(A) Schematic showing the placement of EEG recording electrodes at the dorsolateral border of PFC in adult mice.
(B) Sample prefrontal EEG recordings from both adult Dlx5/6+/− and WT mice around the time of digging in the rule-shifting task; scale bars = 100 μV, 100 msec.
(C) Log transform of the averaged, normalized power spectrum for prefrontal EEG recordings from Dlx5/6+/− (blue trace) and wild-type (black trace) mice. For this plot, the power spectrum from each mouse was normalized by the sum of all values from 0-120 Hz (excluding 58-62 Hz).
(D) Adult Dlx5/6+/− mice exhibit an increase in the power of prefrontal baseline γ (30-120 Hz) oscillations compared to their age-matched WT littermates.
(E) Change in unnormalized power (measured in log units) during the first ten trials of the rule- shifting portion of the task, compared to the baseline period, in 7-week old WT and Dlx5/6+/− mice. Task-evoked fast γ oscillations (62-120 Hz) are not significantly different between both genotypes.
(F) During periods of social interaction, both 7-week old wild-type and age-matched Dlx5/6+/− mice show a similar increase in prefrontal γ oscillations (compared to baseline).
(G) Task-evoked γ oscillations are significantly smaller in adult Dlx5/6+/− mice compared to age- matched WT littermates.
(H) During periods of social interaction, adult WT mice show an increase in the power of prefrontal γ oscillations (relative to baseline) compared to no change or a slight decrease in prefrontal γ power in age-matched Dlx5/6+/− mice.
To analyze changes in power during the baseline period (which was just before the social interaction task), we first used 2-way ANOVA and found significant effects of genotype (p<0.001), frequency (p<0.001), and genotype × frequency (p<0.05). We then checked for differences between genotypes for each frequency band using two-tailed, unpaired Student's t-tests. For the rule-shifting task, we used repeated measures ANOVA with mouse, condition / time during task (baseline or time relative to digging), and genotype × condition (baseline vs. task) as factors; asterisks indicate significance of the genotype × condition interaction. For social interaction, we used repeated measures ANOVA with mouse, task condition (baseline vs. social interaction), and genotype × condition (baseline vs. social interaction) as factors; asterisks indicate the significance of the genotype × condition interaction.
All data show means ± SEM and are analyzed using two-tailed Student's unpaired t-tests or 2- way ANOVA or repeated measures ANOVA. **p < 0.01, ***p < 0.001.
See also Figure S4.

