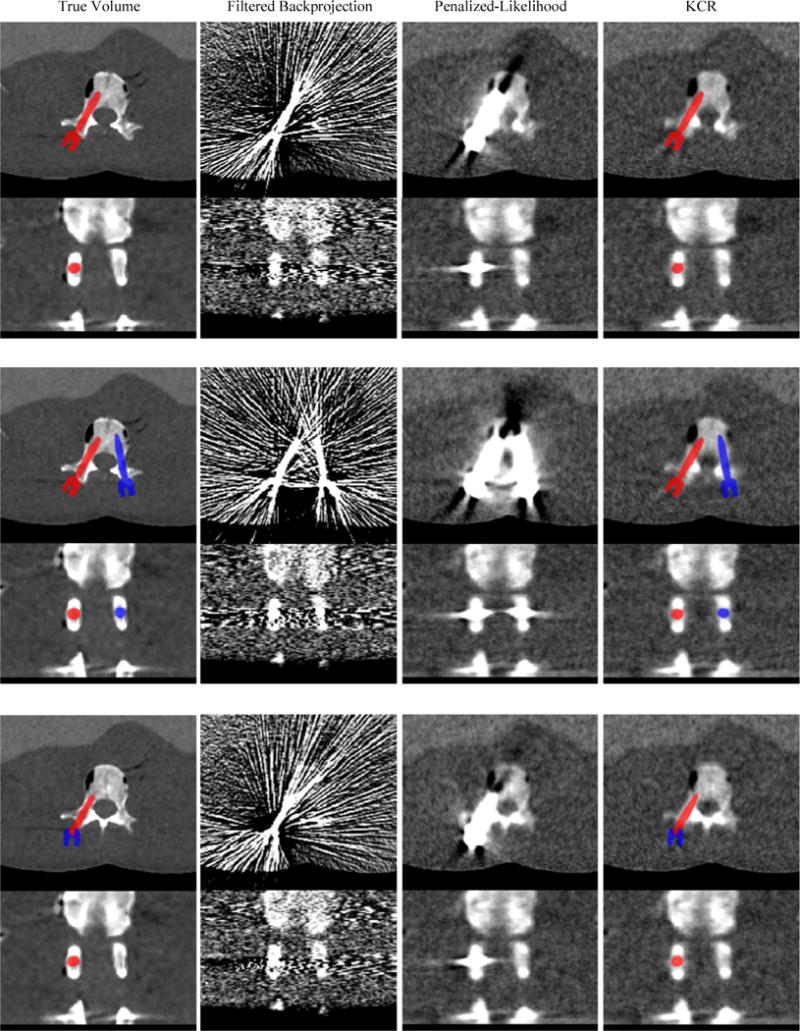
Figure 5.

Illustration of the image quality of KCR compared to FBP and traditional PL estimation. Axial and coronal images are presented for each method and each pedicle screw implant scenario: Top) Unilateral single-component screw; Middle) Bilateral single-component screws; Bottom) Unilateral two-component polyaxial screw. The window and level for all images is 500 and 150 HU, respectively. The color overlay in the true image (left) shows the true pose of the component(s), whereas that in the KCR reconstruction (right) shows the pose as estimated by the simultaneous registration and reconstruction process.
