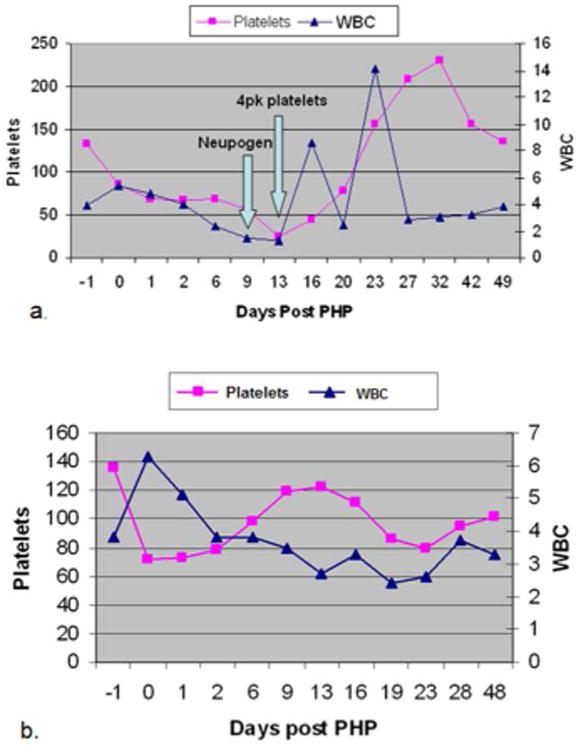
Figure 6.

Line graphs showing serum platelet and white blood cell (WBC) levels in patient number 8 (from Table 1) before and after percutaneous hepatic perfusion (PHP) treatment. Panel a. shows levels after the first PHP treatment which utilized the first generation chemofiltration filter. Arrows indicate when platelets were transfused due to thrombocytopenia, and when Neupogen (WBC colony stimulating factor), was started due to leukopenia. Panel b. shows the same patient's serum platelet and WBC levels before and after her second PHP treatment which utilized the second generation chemofiltration filter. Note the levels did not fall below thresholds, and therefore no transfusions or Neupogen were given. (4pk = 4 pack unit of platelets).
