
Figure 6.
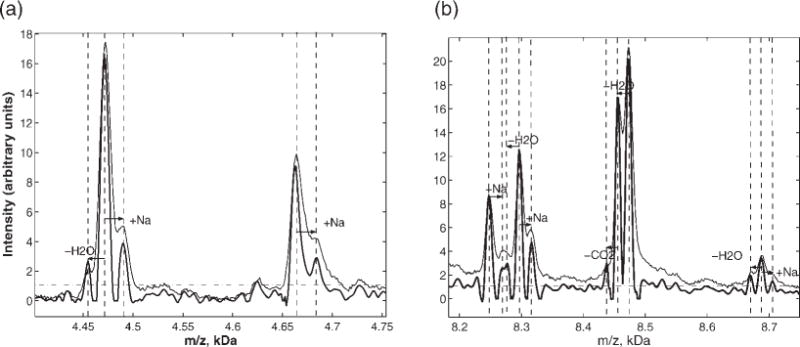
SELDI spectra for pooled serum (thin line), and resolution-enhanced filtered data near 4 and 8 kDa. The filtered signal is the geometric average of three filters (Γt 0.2Γin, v = 0.01; Γt = 0.2Γin, v = 0.001; Γt = 0.5Γin, v = 0.0001;). The horizontal dashed line shows the SNR threshold for peak detection. The mass differences for the deconvolved peaks suggest sodium adducts and neutral losses as indicated by dashed lines and arrows.