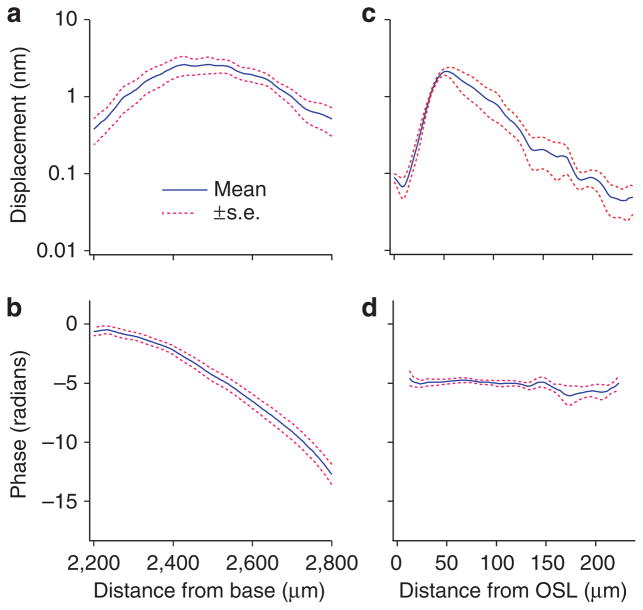
Figure 2. Grouped magnitude and phase data of basilar membrane vibration.
(a) The longitudinal magnitude pattern of the basilar membrane response to a 40-dB SPL 16-kHz tone, presented by means (blue solid line) and range of the standard error (red dotted lines) from five cochleae. (b) Corresponding longitudinal phase data. (c) Displacement magnitude as a function of the radial location. Standard errors near the osseous spiral lamina (OSOSL) are smaller than those in the region between 80 to 240 μm due to the relatively high reflectivity. (d) Corresponding radial phase data show little change across the basilar membrane.

