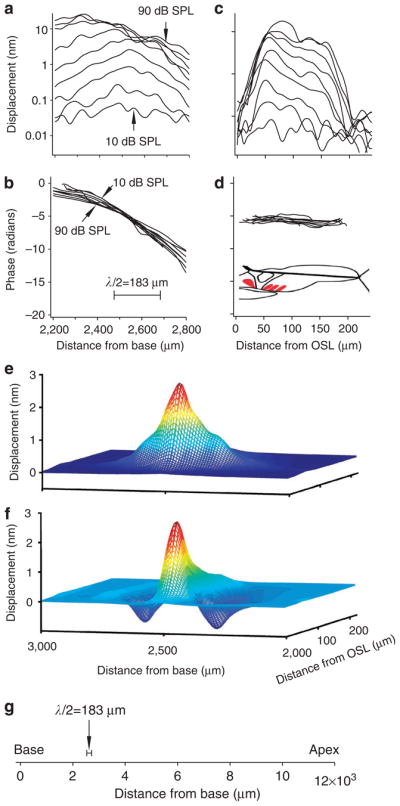
Figure 4. Spatial patterns of basilar membrane vibration.

Magnitude and phase of the basilar membrane vibration were measured as functions of the longitudinal and radial locations (a–d). The spatial pattern (e) and volume displacement (f) were calculated from the longitudinal and radial data. (a) At low sound levels from 10 to 40 dB SPL, the vibration increases with the distance from the cochlear base and forms a peak at ~2,500 μm. As the stimulus increased ~10,000-fold from 10 to 90 dB SPL, the response peak increased only ~100-fold, from ~0.1 to ~10 nm and shifted towards the base (left). (b) Phase decreased with longitudinal location. The phase slope became flatter at high sound levels. (c) Magnitude as a function of radial location, indicated by the distance from the osseous spiral lamina (OSOSL). The displacement magnitude varied significantly radially. (d) Phase show no significant change across the basilar membrane. Cartoon inset indicates the cross-section of the cochlear partition, with one inner hair cell (left) and three outer hair cells in red. (e) Magnitude spatial pattern of basilar membrane response to a 40-dB SPL 16-kHz tone. (f) Instantaneous waveform of the basilar membrane vibration. Blue and red colours in e and f show the low and high magnitude of the basilar membrane vibration, respectively. (g) Spatial relationship of the quantified half wavelength and the basilar membrane length.
