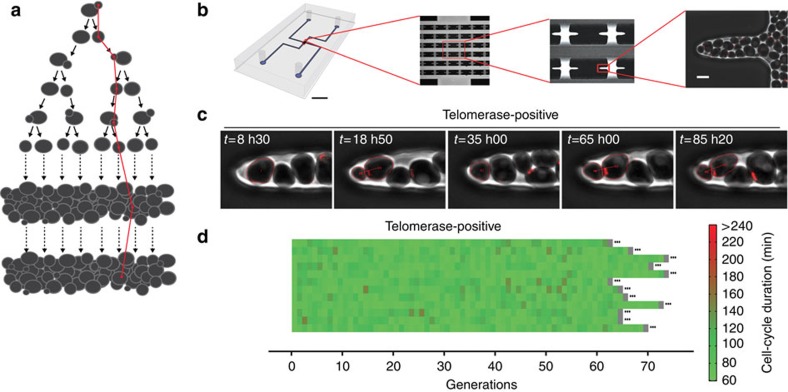
Figure 1. A microfluidics-based approach to the analysis of single lineages.
(a) Schematic representation of single-lineage tracking (in red). Starting from a single cell, we followed the lineage by tracking one of the two cells after each division, regardless of the daughter/mother cell status. (b) Image of the microfluidics chip showing the design of the chambers and microcavities. Scale bars, 5 mm (black) and 5 μm (white). (c) Overlays of sequential phase contrast and fluorescence images of a telomerase-positive cell lineage. The Cdc10-mCherry marker at the bud neck (red) allows monitoring of cell-cycle progression and the mother–daughter relationship. (d) Display of independent wild-type lineages (yT538, n=12). Each horizontal line represents a single lineage, and each segment is a cell cycle. The ellipsis (…) at the end of each lineage indicates that the cell was still alive at the end of the experiment. Cell-cycle duration is indicated by the colour bar.

