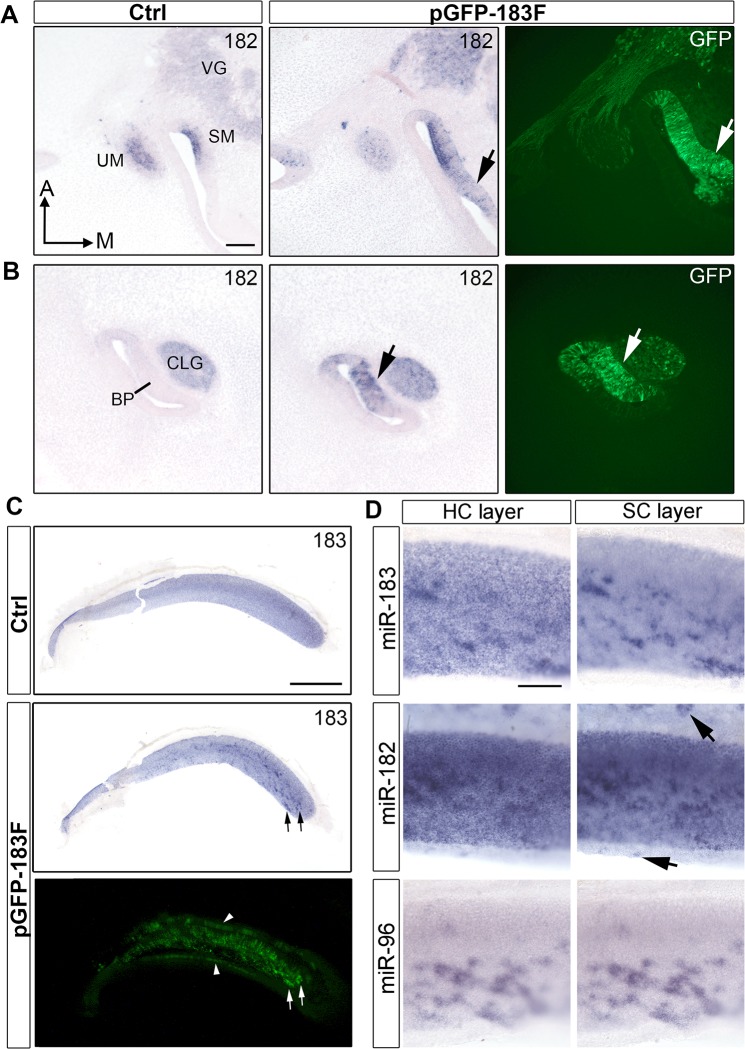
Fig 4. Ectopic expression of miR-183 family is confirmed in vivo at S31 and S40.
(A, B) miR-182 expression in left control and right pGFP-183F-transfected ears of a S31 embryo that was electroporated at S17. Immunostaining of GFP from adjacent sections through the right BP is shown in the right column. (A) Sections through the maculae show ectopic miR-182 signal in the right ear that overlaps with GFP immunolabeling adjacent to the saccular macula (arrows). Also, foci of stronger miR-182 signal in the vestibular ganglion correspond to regions showing GFP+ cells. (B) Sections through the BPs show GFP expression in (arrows) and adjacent to the sensory region that overlaps with foci of higher miR-182 signal. Ectopic expression is also present in the cochleolagenar ganglion. (C) miR-183 expression shown by in situ hybridization in left control and right pGFP-183F-electroporated BPs at S40 (electroporated at S11+), with GFP fluorescence for comparison in the right ear. Arrows point to examples where GFP+ cells superimpose with a higher intensity of signal for miR-183. Note the presence of GFP in the non-sensory epithelial cells (arrowheads) on both sides of the BP. These transfected cells are not visible in the image taken after in situ hybridization because these epithelial domains were removed for flat mounting. (D) Patches of overexpression in S40 BPs (electroporated at S11+, S12 and S14, respectively) are readily apparent for miR-183, miR-182 and miR-96. Separate images with focus on the HC layer versus SC layer are presented. Arrows point to ectopic expression in non-sensory epithelial cells. Scale bar in A and D equal 100μm. Scale bar in C equals 0.5mm.

