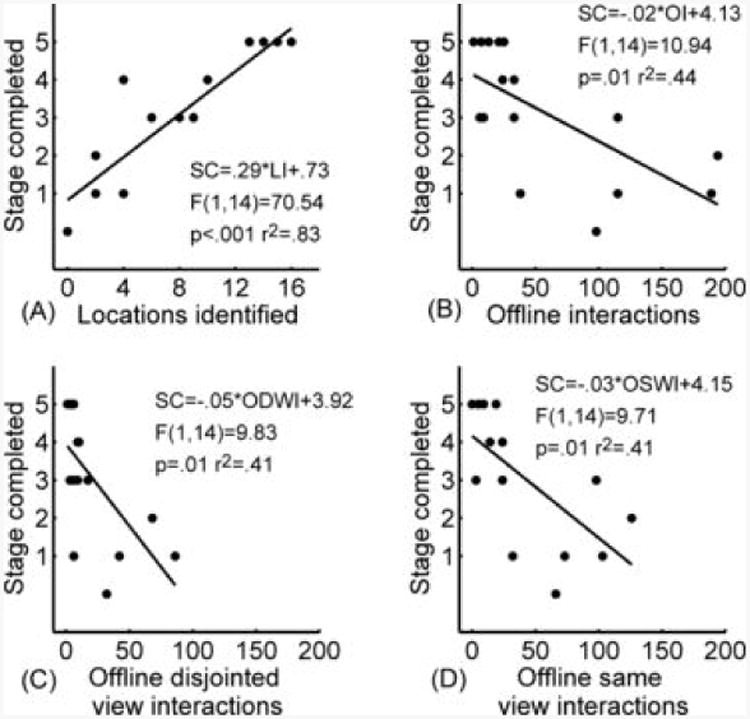
Figure 3.

Scatterplots of the main variables considered in the text. For all scatterplots, the vertical axis represents the maximum stage of the game completed by the pair while the horizontal axis represents: (A) the number of game locations identified by the pairs' communication systems at the end of the game; (B) the number of offline interactions; (C) the number of offline disjointed view interactions and (D) the number of same view interactions. The lines in the graphs represent the linear regression through the data points.
