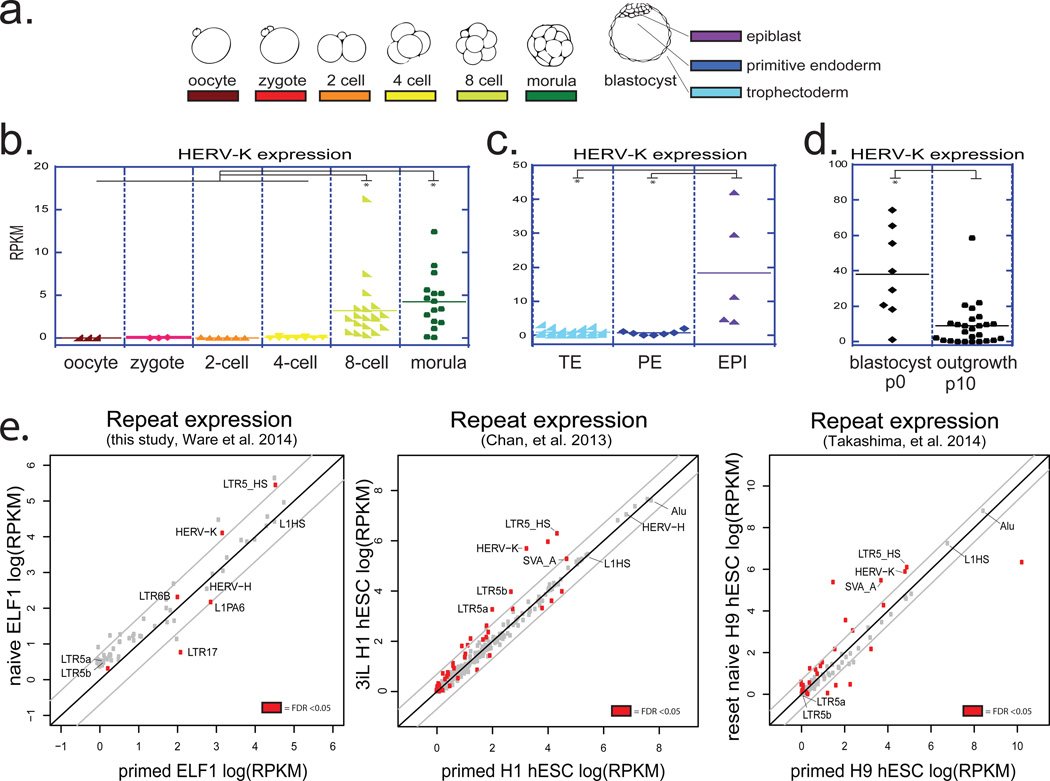
Figure 1. Transcriptional reactivation of HERV-K in human preimplantation embryos and naïve hESC.
a) schematic of human preimplantation development.
b) HERV-K expression in single cells of human embryos at indicated stages. Solid line = mean. Oocyte (n=3), zygote (n=3), 2C (n=6), 4C (n=11), 8C (n=19), morula (n=16). (panels b,c,d; Yan et al., 2013). * denotes p-value <0.05, non-paired Wilcoxon test.
c) HERV-K expression in single cells of human blastocysts, grouped by lineage. Solid line = mean. TE (n=18), PE (n=7), EPI (n=5). Abbreviations: TE=trophectoderm, PE=primitive endoderm, EPI=epiblast.
d) HERV-K expression in single cells of blastocyst outgrowths (passage 0) or hESCs at passage 10. Solid line = mean. p0 (n=8), p10 (n=26).
e) Analysis of the repetitive transcriptomes of three, genetically matched naive/primed hESC pairs. Left: naïve/primed ELF1 hESC (this study; Ware, et al. 2014) (n= 3 biological replicates for both conditions). Middle: 3iL/primed H1 hESC (Chan, et al. 2013) (n=3 biological replicates for both conditions). Right: naïve/primed H9 hESC (Takashima, et al. 2014, right) (n=3 biological replicates for both conditions). Significant repeats indicated in red at FDR <0.05, DESeq.

