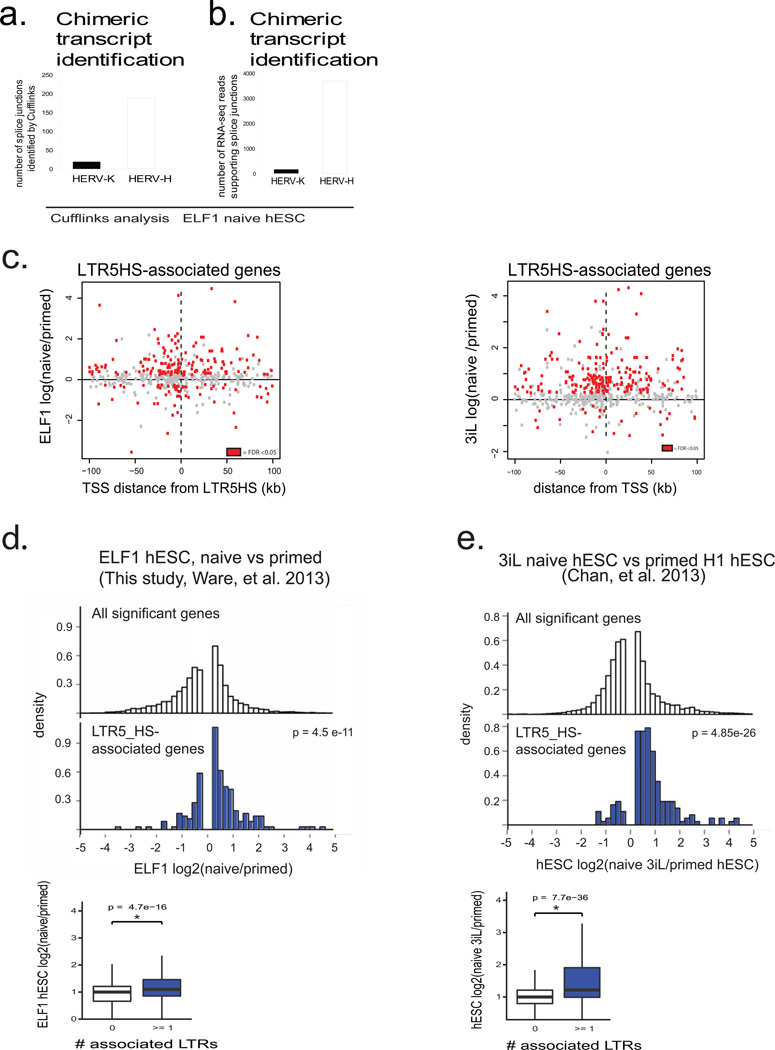
Extended Data Figure 6. Correlation of HERV-K LTR5HS elements with gene expression (supporting Fig. 4).
a) Number of splice junctions identified linking indicated HERV class to annotated ReqSeq genes. Analysis was done using RNA-seq dataset from ELF1 naïve hESC, n= 3 biological replicates.
b) Number of reads supporting chimeric transcripts from indicated HERV class in ELF1 naïve hESC, n =3 biological replicates.
c) Expression of LTR5_HS linked genes plotted as a function of distance to the gene's TSS. X axis: distance of TSS from the nearest LTR5_HS in kb; Y axis: fold change in expression in ELF1 naive vs primed hESC (this study, left) the 3iL versus primed H1 hESC (right, Chan et al. 2013).
d) Top panel: Histograms showing expression of all genes that significantly change in expression between naïve and primed ELF1 hESC (top histogram, white) or significantly changed genes that are LTR5_HS associated (bottom histogram, blue); expression values from naïve vs primed ELF1 hESC RNA-seq datasets (FDR <0.05 DESeq). Fischer's exact test gives indicated p-value indicating enrichment of LTR5HS linked genes in naïve upregulated category. Bottom panel: quantification of average expression of LTR5HS-linked (blue) or unlinked (white) genes. Non-paired Wilcoxon test with stated p-value indicating that genes linked to 1 or more LTR5HS have significantly higher mean expression.
e) Top panel: Histograms showing expression of all genes that significantly change in expression between 3iL and primed H1 hESC (top histogram, white) or significantly changed genes that are LTR5_HS associated (bottom histogram, blue); expression values from RNA-seq datasets reported by Chan, et al. 2013, FDR <0.05 DESeq. Fischer's exact test gives indicated p-value indicating enrichment of LTR5HS linked genes in naïve upregulated category. Bottom panel: quantification of average expression of LTR5HS-linked (blue) or unlinked (white) genes. Non-paired Wilcoxon test with stated p-value indicating that genes linked to 1 or more LTR5HS have significantly higher mean expression.

