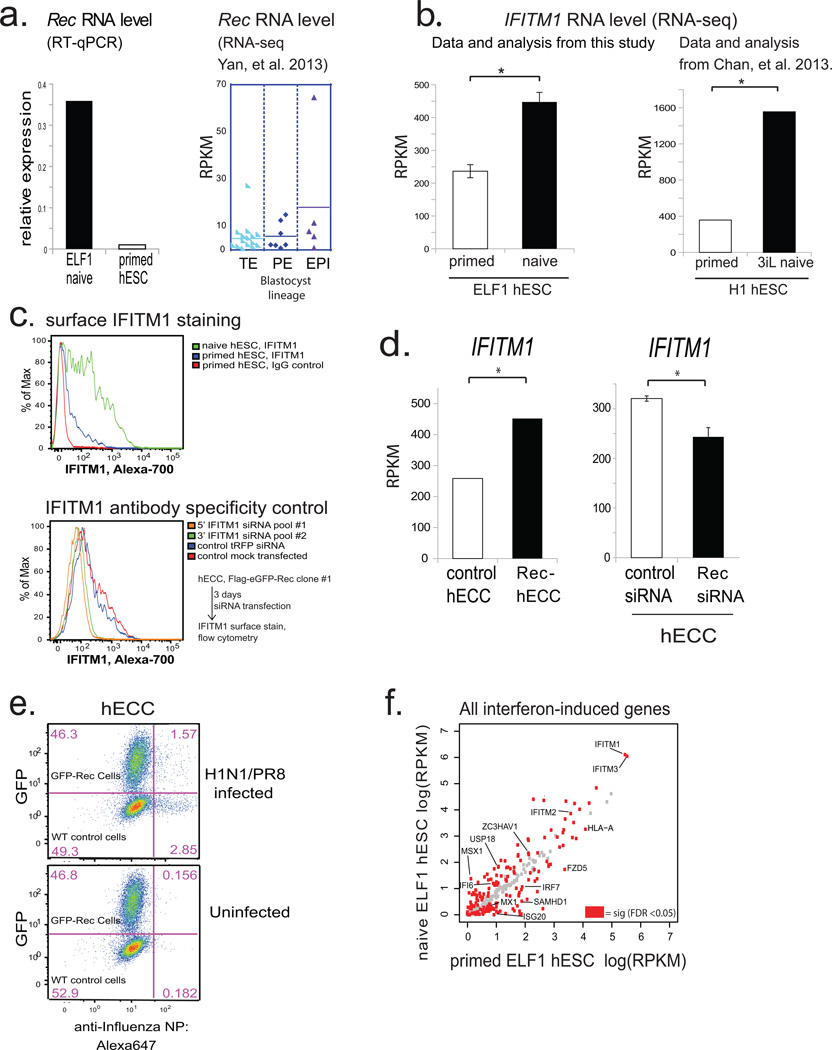
Extended Data Figure 7. Rec and IFITM1 expression in naïve hESC, and effect of Rec expression on H1N1(PR8) infection (supporting Fig. 4).
a) (left) RT-qPCR analysis of HERV-K Rec expression levels in ELF1 naïve hESC (n=3 biological replicates) or H9 primed hESC(one biological replicate). Normalized to 18s rRNA. Right, Rec RNA levels in indicated blastocyst lineages, solid line= mean; data from Yan, et al. 2013.
b) RNA-seq quantification of IFITM1 RNA levels in naïve or primed ELF1 hESC (left) or 3iL hESC versus primed H1 hESC from Chan, et al. 2013 (right). N= 3 biological replicates for each condition, error-bars = +/− 1 S.D. * indicates significance at FDR<0.05, DESeq.
c) Flow-cytometry for surface-localized IFITM1 staining in the indicated H9 hESC or naïve ELF1 hESC (top panel) or, as a control for IFITM1 antibody specificity, knockdown of IFITM1 with two independent IFITM1 siRNA pools compared to control siRNA treated cells in FLAG-eGFP-Rec-hECCs (bottom panel).
d) Left: IFITM1 expression in control hECC vs Rec-hECC (NCCIT) RNA-seq datasets. N = 2 biological replicates. Significance = FDR<0.05, DESeq. Right: IFITM1 expression in control siRNA vs Rec siRNA-treated hECC (NCCIT) RNA-seq. N= 3 biological replicates, error-bars = +/− 1 S.D. Significance = FDR<0.05, DESeq.
e) Flow-cytometry profiles for indicated cell types in H1N1(PR8) infected (top) or non-infected (bottom) wildtype (WT) control hECC or FLAG-GFP-Rec-hECC, clone #1. Shown is one representative example of 4 independent experiments showing a co-plating experiment in which GFP-Rec cells and wildtype control (GFP negative) cells are infected in the same well, stained in the same tube and identified by GFP fluorescence after gating for FSC and SSC.
f) Scatterplot of ELF1 naïve vs primed hESC RNA-seq showing all interferon induced genes, with differentially regulated genes (FDR<0.05 DESeq, n= 3 biological replicates each) highlighted in red. There is a significant overlap between differentially regulated genes and interferon-induced genes as measured by a hypergeometric test (p-value <0.05).

