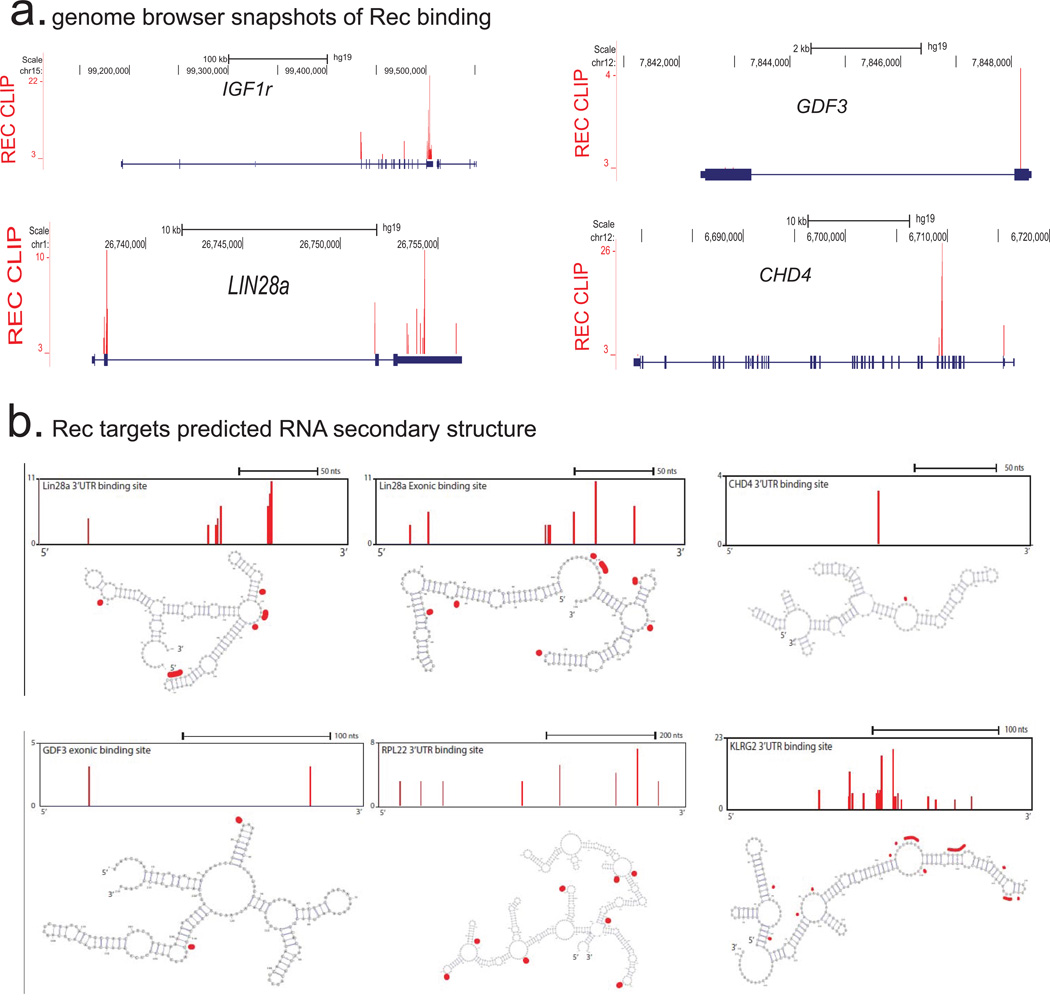
Extended Data Figure 9. Rec target mRNA analysis (supporting figure 4).
a) Genome browser representations of the Rec iCLIP read (n=2 biological replicates) distribution at indicated mRNA targets
b) Computationally predicted (using mFold) secondary structures of indicated Rec iCLIP-seq targets. Single nucleotide resolution Rec UV-crosslinking sites determined by iCLIP are shaded in red; to orient the reader, browser representation of the folded fragment is shown above each respective cartoon.

