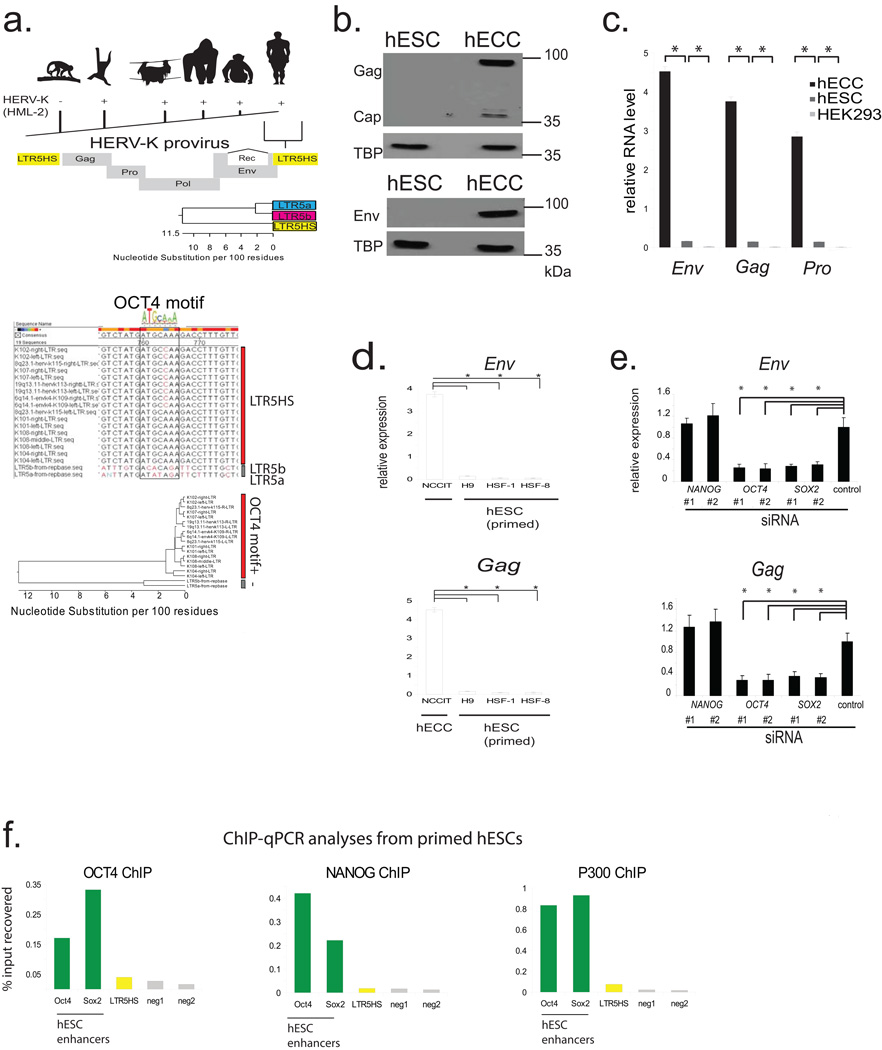
Extended Data Figure 2. LTR5 alignments, HERV-K expression data in cell lines, and control ChIP-qPCR analyses in primed hESC (supporting Fig. 2).
a) Top: Presence of HERV-K (HML-2) sequences in Old World Primates, but absence in New World Primates. Middle: Schematic of HERV-K proviral genome; all human-specific insertions contain LTR5HS. Bottom: Phylogenetic relationship of HERV-K LTR sub-classes showing high degree of sequence similarity. Abbreviations: Gag = group specific antigen, Pro = protease, Pol= polymerase, Env= envelope, LTR= long terminal repeat, Rec = HERV-K accessory protein produced from a doubly-spliced subgenomic transcript. Bottom: ClustLW multiple sequence alignment of indicated HERV-K LTR sequences (top), region around OCT4 motif is boxed, phylogenetic tree (bottom) indicating presence/absence of OCT4 motif.
b) HERV-K protein expression in hECCs and hESCs. Protein extracts from hECCs (NCCIT) and hESC (H9) were analyzed by immunoblotting with an antibody detecting HERV-K Gag precursor and the processed Capsid (top), or glycosylated, unprocessed form of HERV-K envelope protein Env (bottom). Tata-binding protein (TBP) was used as a loading control. Shown is a representative result of three independent experiments.
c) RT-qPCR analysis of HERV-K RNA expression in hECC line NCCIT, hESC line H9, and HEK293 cells. Three distinct qPCR amplicons, corresponding to Env, Gag and Pro are shown. Samples were normalized to 18s rRNA levels. * denotes p-value <0.05, one-sided t-test, error bars= +/− 1 SD, n=3 biological replicates.
d) HERV-K Gag or Env expression in male hESC lines HSF-1, HSF-8, female hESC H9 and hECC line NCCIT.
e) RT-qPCR analysis of HERV-K transcripts after siRNA knockdown of NANOG, OCT4, or SOX2 in hECC (NCCIT). Signals were normalized to 18s rRNA. * denotes p-value <0.05, one sided t-test compared to control siRNA, n=3 biological replicates, error bars are +/− 1 S.D.
f) ChIP-qPCR analyses of hESCs (H9) with indicated antibodies. Signals were interrogated with primer sets for positive control regions (active hESC OCT4 and SOX2 enhancers), LTR5HS, or non-repetitive, intergenic negative regions, as indicated at the bottom. Shown is a representative result of two biological replicates.

