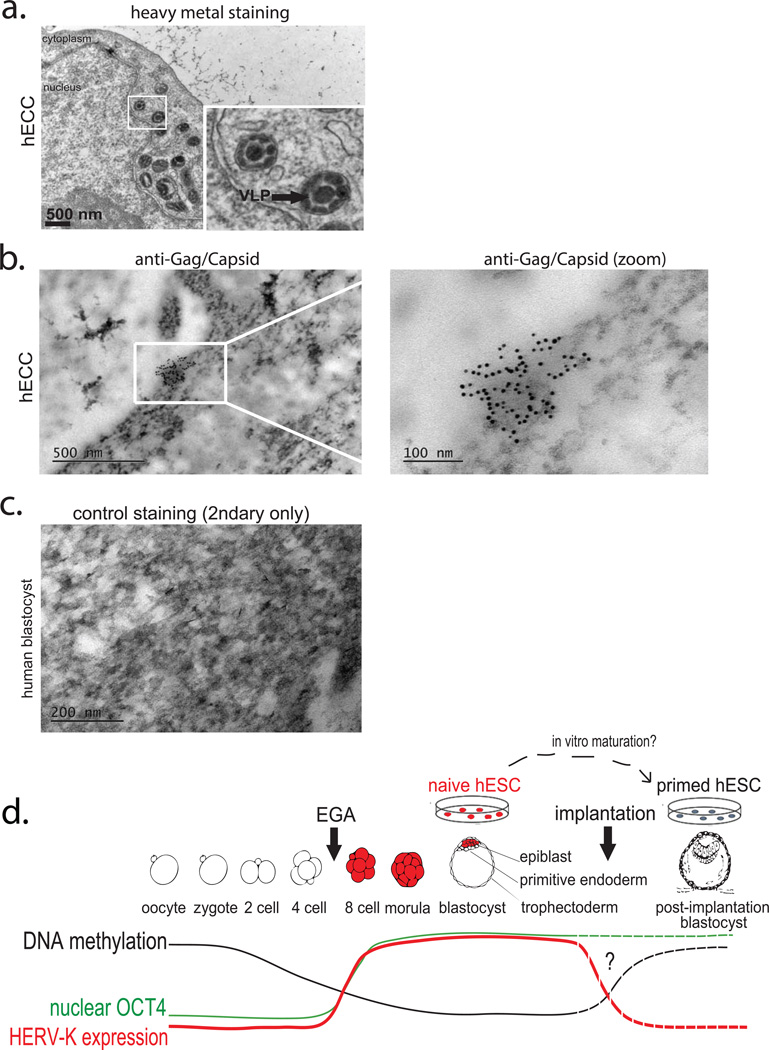
Extended Data Figure 5. TEM analyses of hECCs and control embryo staining (supporting Fig. 3).
a) TEM analysis of hECCs (NCCIT) with heavy metal staining, arrow indicates VLPs. Boxed region is shown with higher magnification in an inset. Scale bar = 500 nm. Shown is a representative example of two independent experiments.
b) TEM immuno-gold labeling of hECC (NCCIT) with Gag/Capsid antibodies. Shown is a representative example from 2 independent experiments.
c) Secondary only control for Immuno-gold labeling of human blastocysts. Shown is a representative example from 8 fields of view.
d) Model figure summarizing HERV-K transcriptional regulation in human embryos and in vitro cultured pluripotent cells. Dashed lines indicate inference of OCT4, DNA methylation and HERV-K level changes at implantation from those observed between naïve and primed hESCs, in the absence of data from actual postimplantation human embryos.

