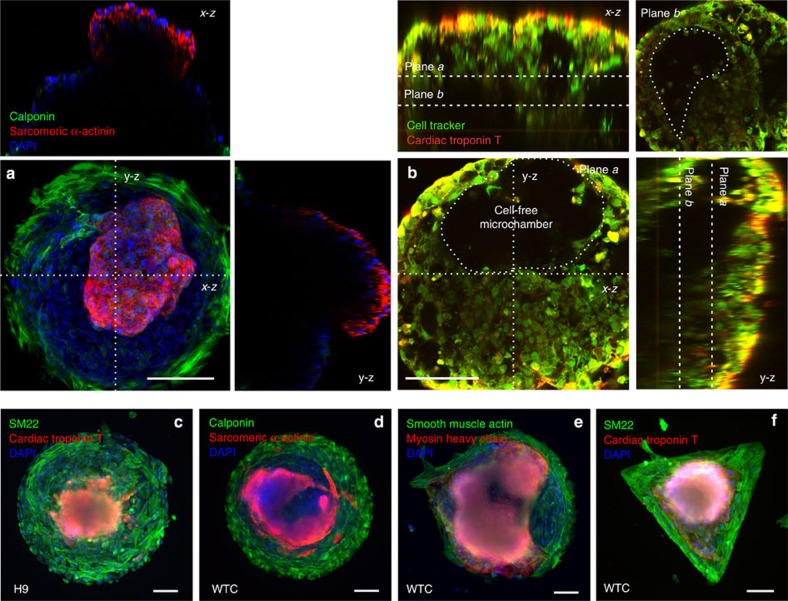
Figure 3. Generation of spatially organized 3D cardiac microchambers.
(a) 3D cardiac microchamber generated from WTC hiPSCs on a 400-μm pattern, where cardiomyocytes only appeared in the centre and myofibroblasts on the perimeter. Panels above and to the right of the main panel represent the z axis projection images at their respective x and y cross-sections. (b) Two-photon microscopy image of the void inside the 3D cardiac microchamber with the cell-free chamber shown at two chamber heights (plane a and b). The z axis projection images at their respective x and y cross-sections are shown in panels above and to the right of the main panel. (b) The image through plane a, and the panel in the upper right shows the image through plane b. The cardiomyocytes in the centre were positive for (c) cardiac troponin T, (d) sarcomeric α-actinin and (e) myosin heavy chain, whereas the myofibroblasts on the perimeter were positive for (c) SM22, (d) calponin and (e) smooth muscle actin. (f) Spatially organized cardiac microchambers were also generated on a triangle pattern with 540-μm leg length and similar area to a 400-μm circular pattern. Scale bars, 100 μm.

