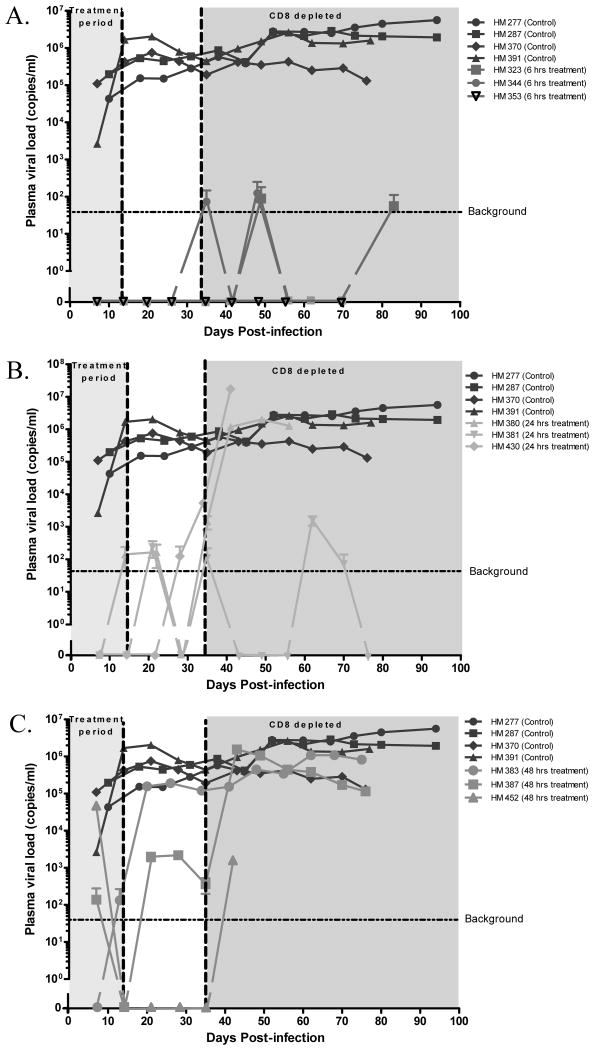
Figure 2. Plasma viral load (PVL).
The identical control animals were included in all graphs for comparison purposes. Background cutoff value of 40 copies/ml was determined with plasma from non-infected hu-BLT mice. The 2 weeks on ART and CD8+ T-cells depletion period are shaded. (A) Rx-6h. (B) Rx-24h. (C) Rx-48h.

