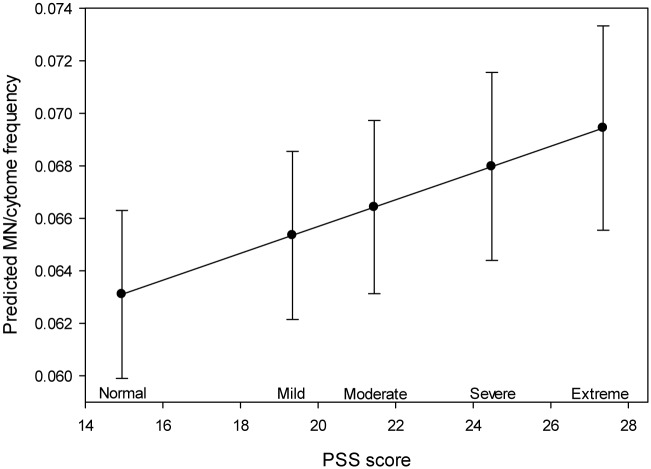
Fig 4. Increased MN/cytome abnormality frequencies were significantly associated with higher levels of perceived stress.
The results of the linear mixed effects model are illustrated in this figure, which shows the increasing trend line of the MN/cytome frequency with increasing PSS (p = 0.0129). The PSS categories proposed by Andreou, et al., 2011 are shown on the X axis (a subset of PSS range); the MN/cytome frequencies (predicted values from linear mixed effects model) are shown on the Y axis.

