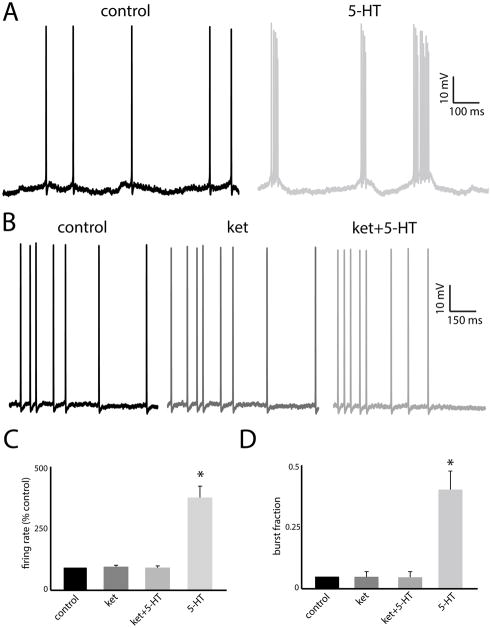
Figure 2.
A: Example voltage traces from a pyramidal neuron under control (left) and after 5-HT application (right). Note the transition from tonic to burst firing. B: Example voltage traces from a pyramidal neuron under control (left), after ket application (center), and after ket+5-HT application (right). Note the similarity between the traces. C: Population-averaged firing rates under all conditions. D: Population-averaged burst fractions under all conditions. “*” indicates that the 5-HT group is significantly different from all others at the p=0.05 level using a one-way ANOVA with Tukey post-hoc highly significant difference (HSD) (n=7). All other comparisons between group pairs were not significant (p>0.1).

