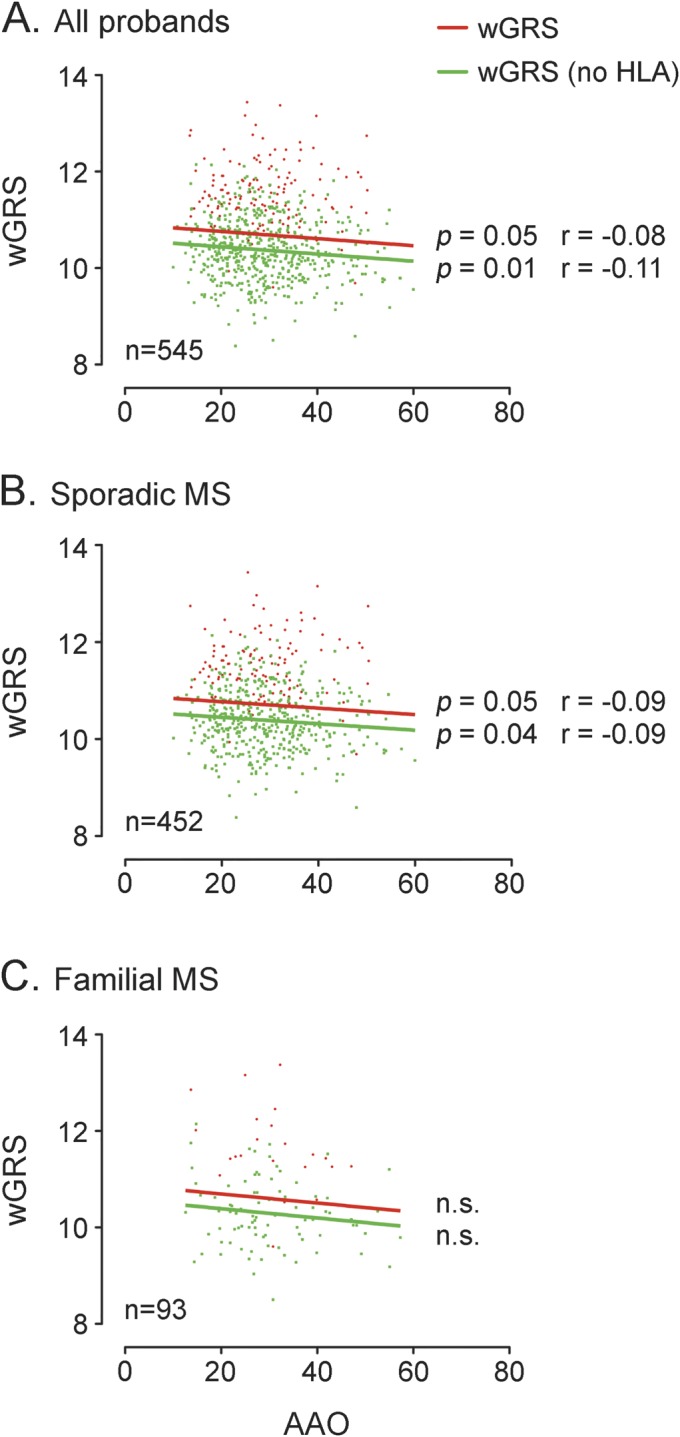
Figure 2. Correlation between wGRS and age at onset.

The figure shows the correlation between weighted genetic risk score (wGRS) and age at onset in all probands (A), patients with sporadic multiple sclerosis (MS) (B), and patients with familial MS (C). The linear regression lines are drawn in solid red and green for wGRS and wGRS without the inclusion of human leukocyte antigen (HLA) in the calculation, respectively. The p values from the Pearson nonparametric correlation test and the r estimates are shown near the regression lines. n.s. = not significant.
