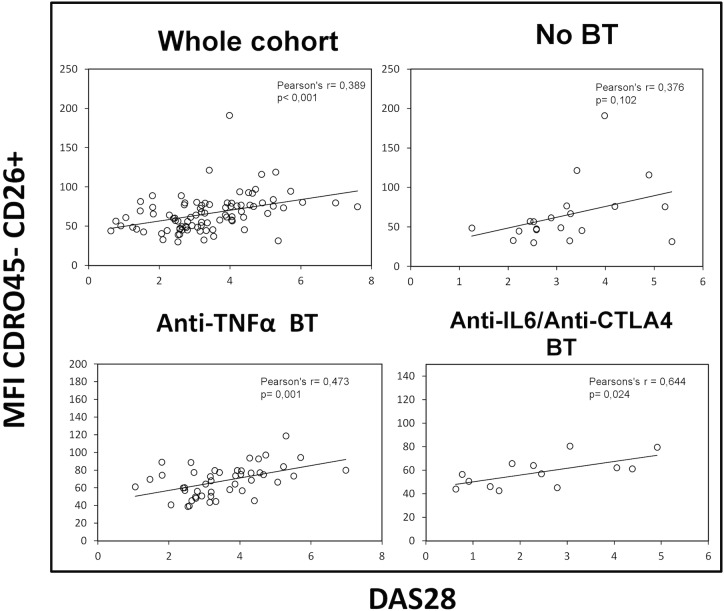
Fig 3. Correlation between disease activity and CD26+ naïve T cells.
DAS28 (Disease Activity Score 28) correlations with CD26 cell surface density of circulating CD4 CD45R0- CD26+ naïve T lymphocytes in the whole cohort of patients (upper left panel), in the No BT group (patients without biological activity, upper right panel), and in two groups of patients with biological therapies (lower panels). Pearson’s coefficient (r) and significance (p) data are insert in the panels.

